Singular value spectrum of low rank matrices obtained from PGC data

Author

Saikat Banerjee

Published

June 4, 2026

Abstract
This notebook analyzes the singular values from the low rank matrices of PGC data.

Background

From the subspace stability cross-validation, we observed that the NNM-Corr’s correlated-noise whitening converts NNM’s all-at-once spectral collapse into an ordered factor-entry path. Click here to view the diagnostics notebook. Here, we check whether the same behavior persists for the full PGC data.

We show the results for 3 groups of traits: 1. All 107 traits 2. Excluding “Biomarkers” traits 3. Excluding “Biomarkers” and “Neurite density” traits

Code
import re
import json
import pickle
from pathlib import Path
import numpy as np
import pandas as pd

import matplotlib.pyplot as plt
from pymir import mpl_stylesheet
from pymir import mpl_utils
mpl_stylesheet.banskt_presentation(splinecolor='black', dpi=300, colors='kelly')

from matplotlib import colormaps as mpl_cmaps
import matplotlib.colors as mpl_colors
from mpl_toolkits.axes_grid1 import make_axes_locatable
Code
trait_dirs = {
    "107 traits": Path("/gpfs/commons/home/sbanerjee/pgc/analysis/clorinn/low_rank_fit"),
    "78 traits":  Path("/gpfs/commons/home/sbanerjee/pgc/analysis/v1.1/low_rank_fit"),
    "51 traits":  Path("/gpfs/commons/home/sbanerjee/pgc/analysis/v1.2/low_rank_fit"),
}
Code
def load_svd_npz(svd_dir, prefix):
    svd_dir = Path(svd_dir)
    rows = []
    for path in svd_dir.glob(f"{prefix}_r*.npz"):
        with np.load(path, allow_pickle=True) as data:
            fit_params = data["fit_params"].item()
            nucnorm = fit_params["nucnorm"]
            s = data["s"]
            n_factors = len(s)
            row = {"nucnorm": nucnorm,}
            row.update({f"s{k}": s[k] for k in range(n_factors)})
            rows.append(row)
    df = (pd.DataFrame(rows)
              .sort_values(["nucnorm"])
              .reset_index(drop=True))
    return df

def get_singular_value_metrics(df, k_list=None, metric="value"):
    s_cols = sorted(
                [c for c in df.columns if re.match(r"^s\d+$", c)],
                key=lambda x: int(x[1:])
             )
    k_obs  = np.asarray([int(x[1:]) + 1 for x in s_cols]) # observed k values, idx + 1
    k_req  = k_obs if k_list is None else np.asarray(k_list)
    k_idx  = np.searchsorted(k_obs, k_req)
    
    if metric in ("gap_ratio", "relative_gap"):
        # requires k_next 
        valid = (k_idx >= 0) & (k_idx < len(k_obs) - 1)
        if not np.all(valid):
            raise ValueError(f"Some requested k are not available: {k_req[~valid]}")

    S     = df[s_cols].to_numpy() # nucnorms x k_obs
    s_1   = S[:, k_obs == 1] # first eigenvalue (max eigenvalue) for all r/x
    s_sum = np.sum(S, axis = 1, keepdims = True)
    
    y = S[:, k_idx]
    if metric == "norm_value":
        y /= s_1
    elif metric == "gap_ratio":
        y /= S[:, k_idx + 1]
    elif metric == "relative_gap":
        y = (y - S[:, k_idx + 1]) / np.where(y > 0, y, np.nan)
        
    return y


def get_effective_rank_at_nucnorm(df, nucnorm, *, thres=0.9, method="energy"):
    S_arr = get_singular_value_metrics(df, metric="value")
    norms = df["nucnorm"].to_numpy(dtype=float).ravel()
    r_idx = np.searchsorted(norms, nucnorm)
    s = S_arr[r_idx, :].ravel()

    if method == "energy":
        cum = np.cumsum(s) / np.sum(s)
        idx = np.searchsorted(cum, thres)
        return int(idx)
    elif method == "participation_ratio":
        s2 = np.sum(s**2)
        idx = float((np.sum(s)**2) / s2) if s2 > 0 else 0.0
        return idx
    elif method == "count":
        t = thres * np.max(s)
        return np.sum(s > t)
    elif method == "spectral_gap":
        gap = s[:-1] - s[1:]
        rel_gap = gap / np.where(s[:-1] > 0, s[:-1], np.nan)
        return int(np.argmax(rel_gap)) + 1
    elif method == "spectral_gap_loose":
        gap = s[:-1] - s[1:]
        rel_gap = gap / np.where(s[:-1] > 0, s[:-1], np.nan)
        gap_thres = thres * np.max(rel_gap)
        idx = np.max(np.where(rel_gap > gap_thres))
        return int(idx) + 1
    else:
        raise ValueError("Method undefined.")
        
def get_effective_ranks(df, nucnorms, *, thres=0.9, method="energy"):
    ranks= (
        [get_effective_rank_at_nucnorm(df, r, method=method, thres=thres) 
         for r in nucnorms]
    )
    return np.asarray(ranks)

Choose the ranks to show in each plot

Code
def r_at_target_rank(df, k_target, *, method="energy", thres=0.95):
    nucnorms = df["nucnorm"].to_numpy(float)
    ranks = get_effective_ranks(df, nucnorms, method=method, thres=thres).astype(float)
    order = np.argsort(nucnorms)
    r, g = nucnorms[order], ranks[order]
    hit = np.where(g >= k_target)[0]
    if len(hit) == 0:
        return np.nan                      # k_target not reached on this grid
    j = hit[0]
    if j == 0:
        return r[0]
    # snap to whichever bracketing grid point is closer in rank
    return r[j] if abs(g[j] - k_target) <= abs(g[j-1] - k_target) else r[j-1]


def choose_rank_for_one_subset(svd_out_dir, k_star):
    for k_target in [k_star]:
        r_corr = r_at_target_rank(load_svd_npz(svd_out_dir, "pgd_fw_nnm_corr"), k_target)
        r_nnm  = r_at_target_rank(load_svd_npz(svd_out_dir, "pgd_fw_nnm"),      k_target)

    return {
        "k": k_star,
        "NNM": r_nnm,
        "NNM-Corr": r_corr,
    }


# k_choose = {
#     "107 traits": 30,
#     "78 traits":  25,
#     "51 traits":  10,
# }

k_choose = {
    "107 traits": 20,
    "78 traits":  15,
    "51 traits":  6,
}
   
rows = {
    data_name: choose_rank_for_one_subset(
        Path(data_root) / "svd", 
        k_choose[data_name]) for data_name, data_root in trait_dirs.items()
}

rank_df = pd.DataFrame(rows).T
    
from IPython.display import display, HTML
# display(rank_df.style.format({"Effective Rank": "{:g}"}))
display(HTML(rank_df.to_html()))
k NNM NNM-Corr
107 traits 20.0 8192.0 1290.0
78 traits 15.0 3251.0 406.0
51 traits 6.0 1290.0 406.0
Code
def get_r_scaled(x, scale="log2"):
    x = np.asarray(x, dtype=float)
    powers = np.arange(np.ceil(np.log2(x.min())), np.floor(np.log2(x.max())) + 1)
    xlabels = 2 ** powers
    
    if scale == "log10":
        xscale = np.log10(x)
        xticks = np.log10(xlabels)
    elif scale == "log2":
        xscale = np.log2(x)
        xticks = np.log2(xlabels)
    else:
        xscale = x
        xticks = xlabels

    xlabel_str = [f"{r:g}" for r in xlabels]
    return xscale, xticks, xlabel_str

def style_blank_axis(ax):
    ax.tick_params(bottom = False, top = False, left = False, right = False,
        labelbottom = False, labeltop = False, labelleft = False, labelright = False)
    

def style_colorbar_yticks(cbar, cmap, norm):
    for tick, value in zip(cbar.ax.yaxis.get_major_ticks(), cbar.ax.get_yticks()):
        color = cmap(norm(value))
        tick.tick1line.set_markeredgecolor(color)
        tick.tick2line.set_markeredgecolor(color)
        tick.tick1line.set_color("none")
        tick.tick2line.set_color("none")
    # for tick_label, value in zip(cbar.ax.get_yticklabels(), cbar.ax.get_yticks()):
        # tick_label.set_color(cmap(norm(value)))


def make_line_plots_with_colorbar_inset(ax, x, y, ycols,
        ylabel="", cbar_label="", cbar_xpos="", show_cbar=True,
        vcenter=None, cmap=None, norm=None):
    """
    Create K = len(ycols) line plots, color maps to values in ycols
    x : ndarray(N,)
    y : ndarray(N, K), columns of y correspond to values in k_list
    
    Returns cmap, norm for future use.
    """
    
    from matplotlib.cm import ScalarMappable

    if cmap is None:
        cmap = mpl_cmaps.get_cmap("viridis").copy()
    if norm is None:
        vmin = min(ycols)
        vmax = max(ycols)
        if vcenter is None: vcenter = (vmin + vmax) / 2.
        norm = mpl_colors.TwoSlopeNorm(vmin=vmin, vcenter=vcenter, vmax=vmax)
    
    for i, k in enumerate(ycols):
        ax.plot(x, y[:, i], color=cmap(norm(i)))
        
    ax.set_ylabel(ylabel)

    if show_cbar:
        cax = ax.inset_axes([cbar_xpos, 0.15, 0.02, 0.7]) 
        sm = ScalarMappable(norm=norm, cmap=cmap)
        cbar = plt.colorbar(sm, cax=cax, fraction = 0.1)

        # Colorbar style
        style_blank_axis(cbar.ax)
        cbar.ax.tick_params(right=True, labelright=True, pad=5, width=2, length=5)
        cbar.set_label(cbar_label, labelpad = 10)
        cbar.ax.yaxis.set_label_position('left')
        style_colorbar_yticks(cbar, cmap, norm)
        for side, border in list(cbar.ax.spines.items()):
            border.set_visible(False)

    return cmap, norm
    
        
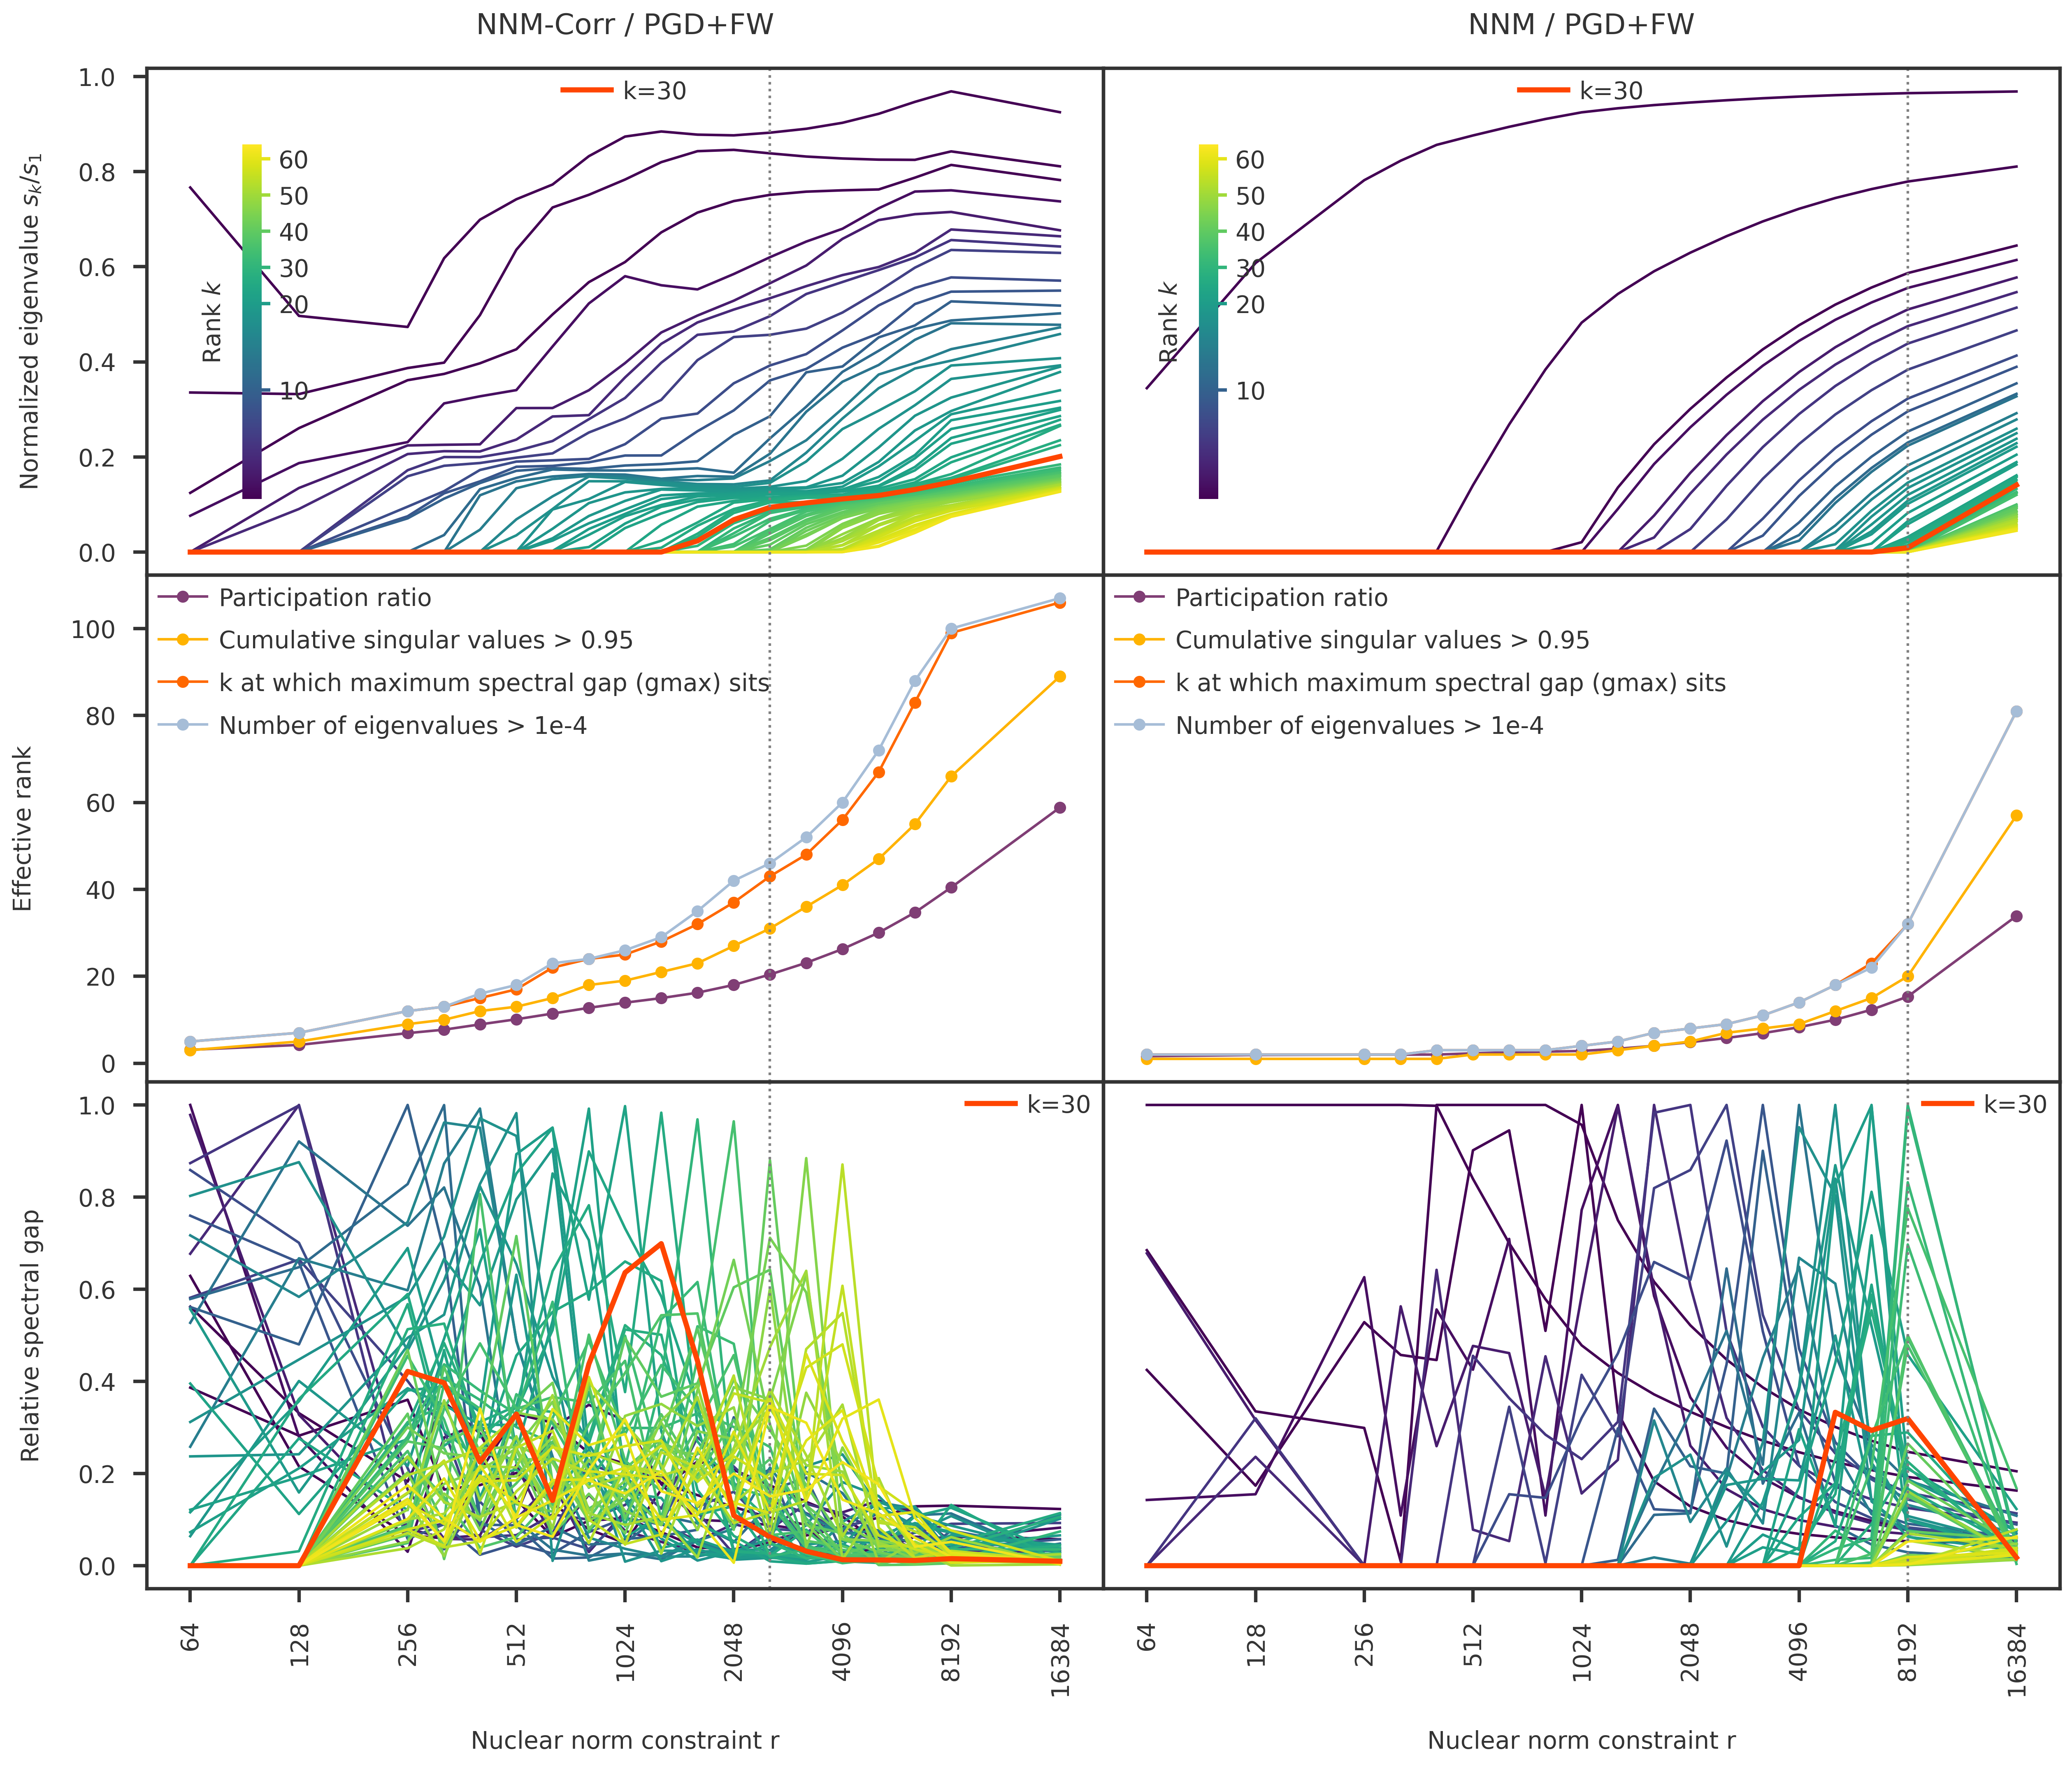
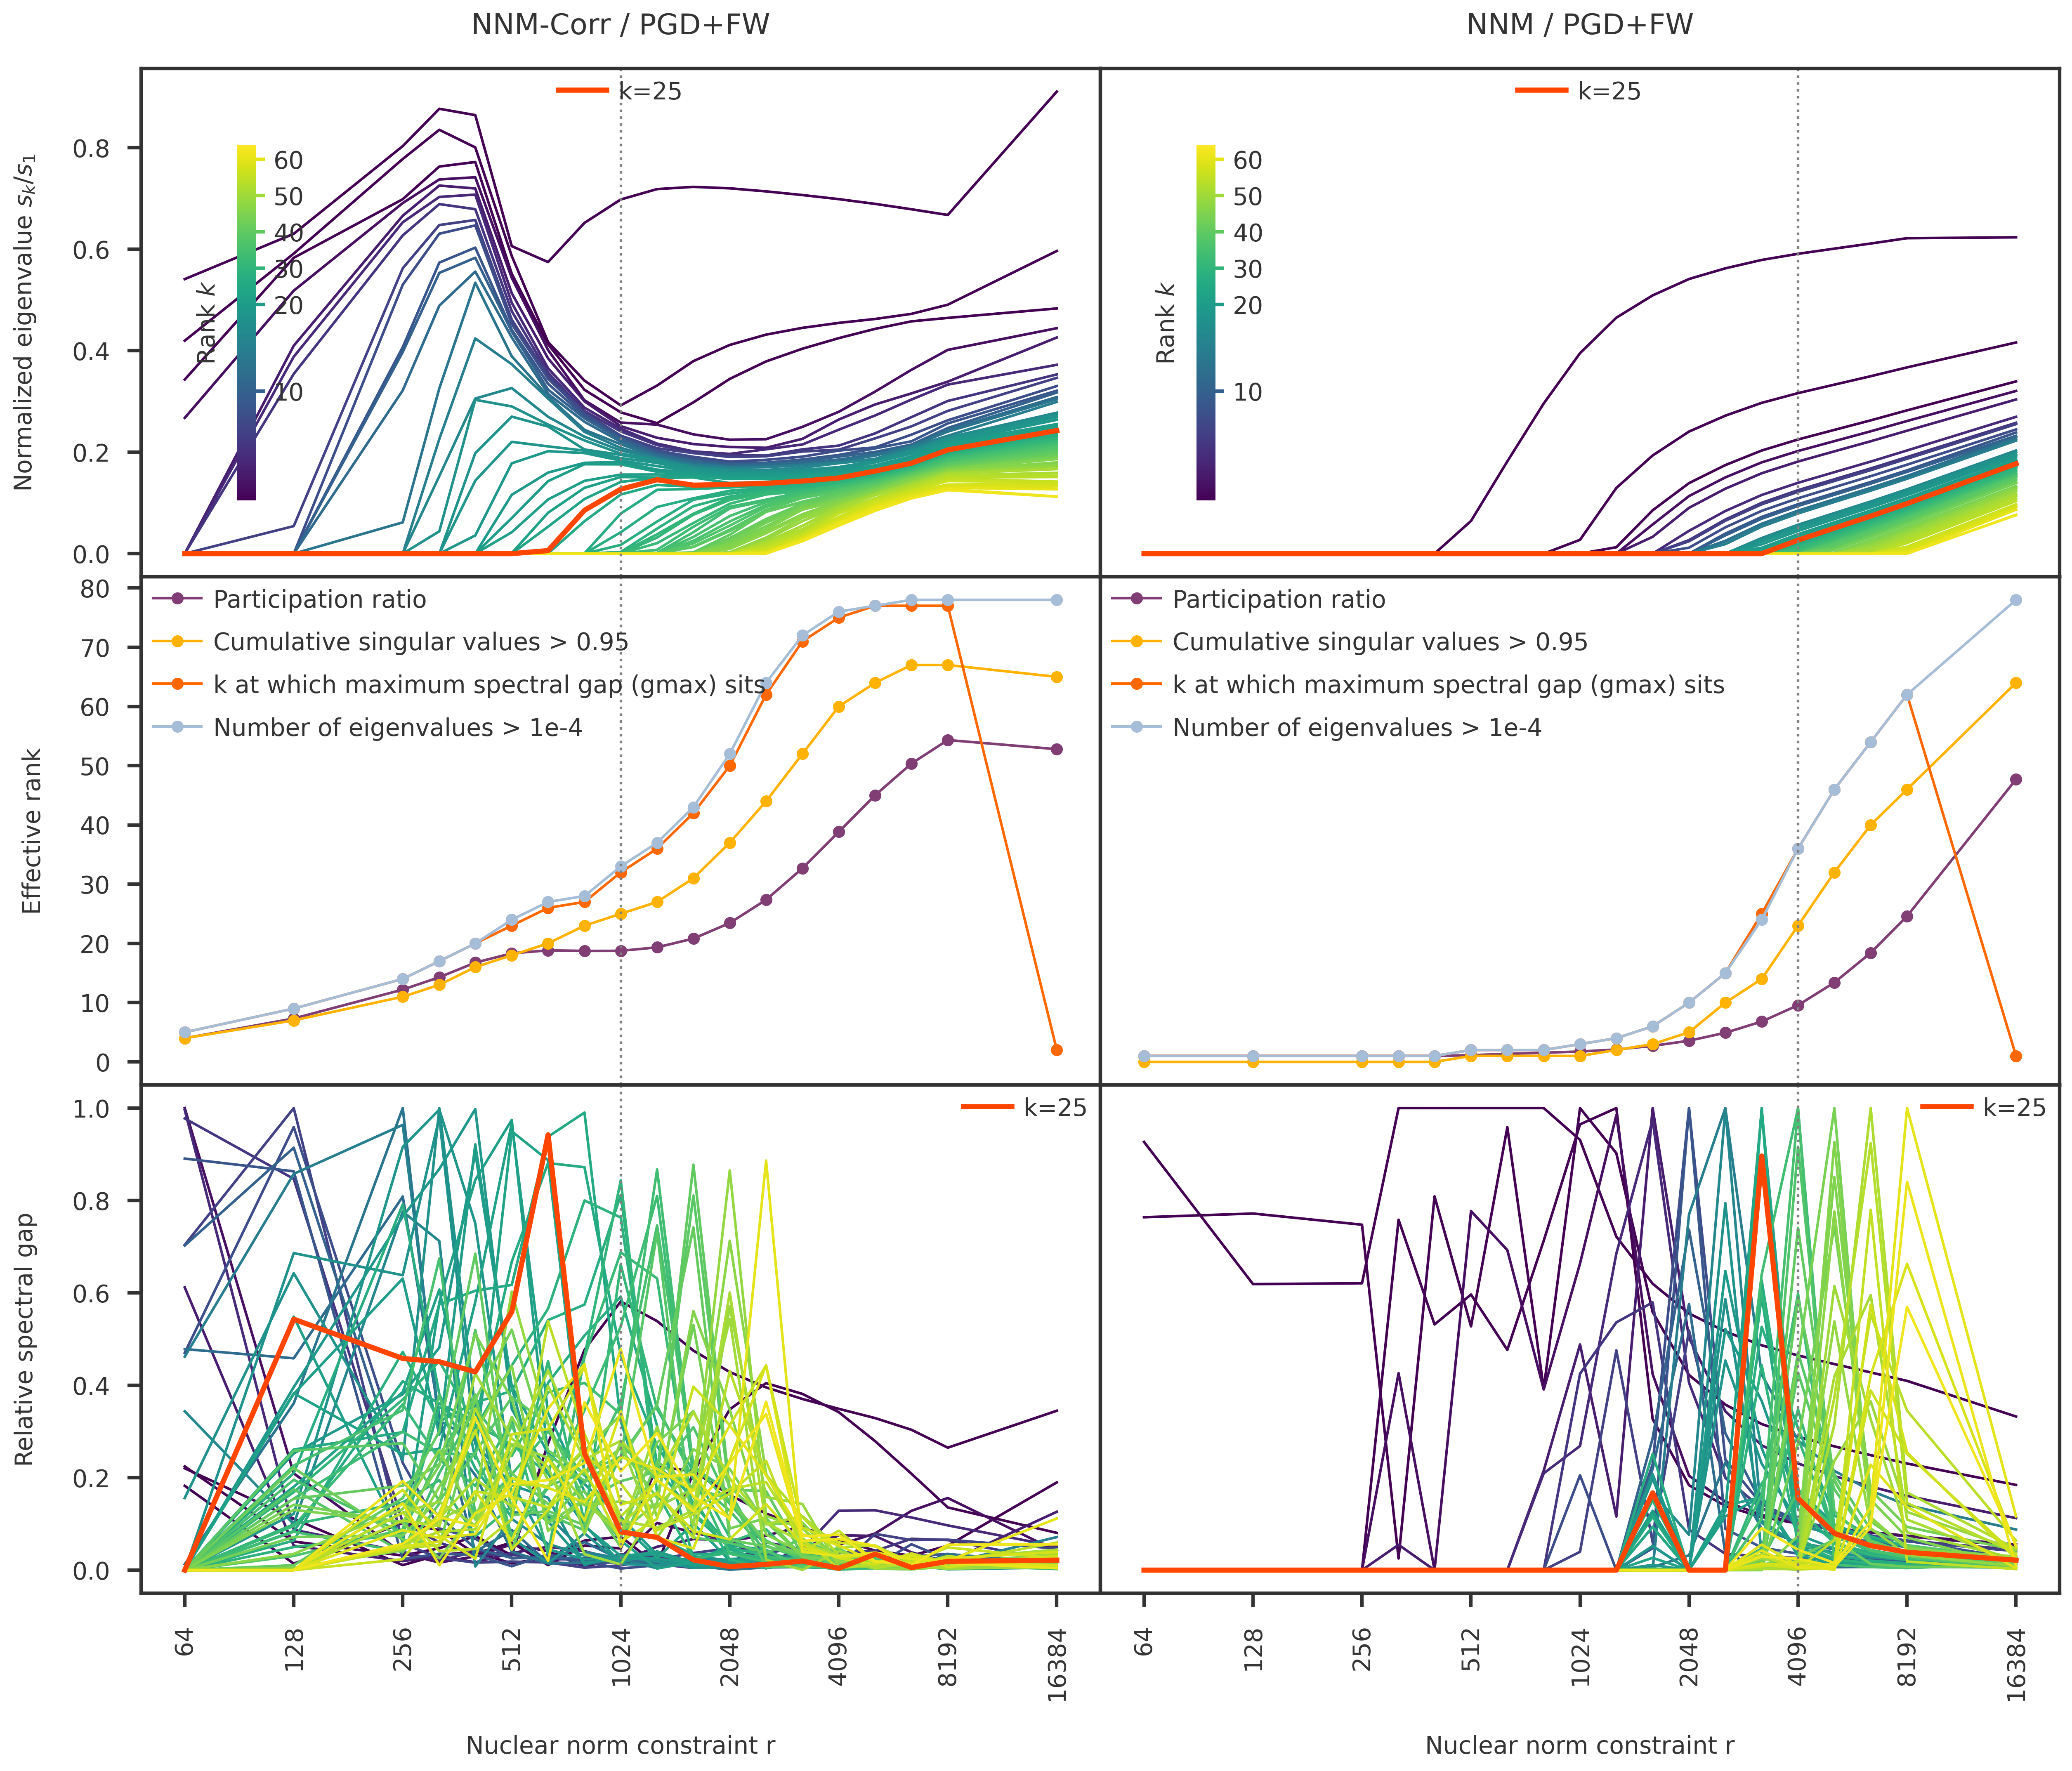
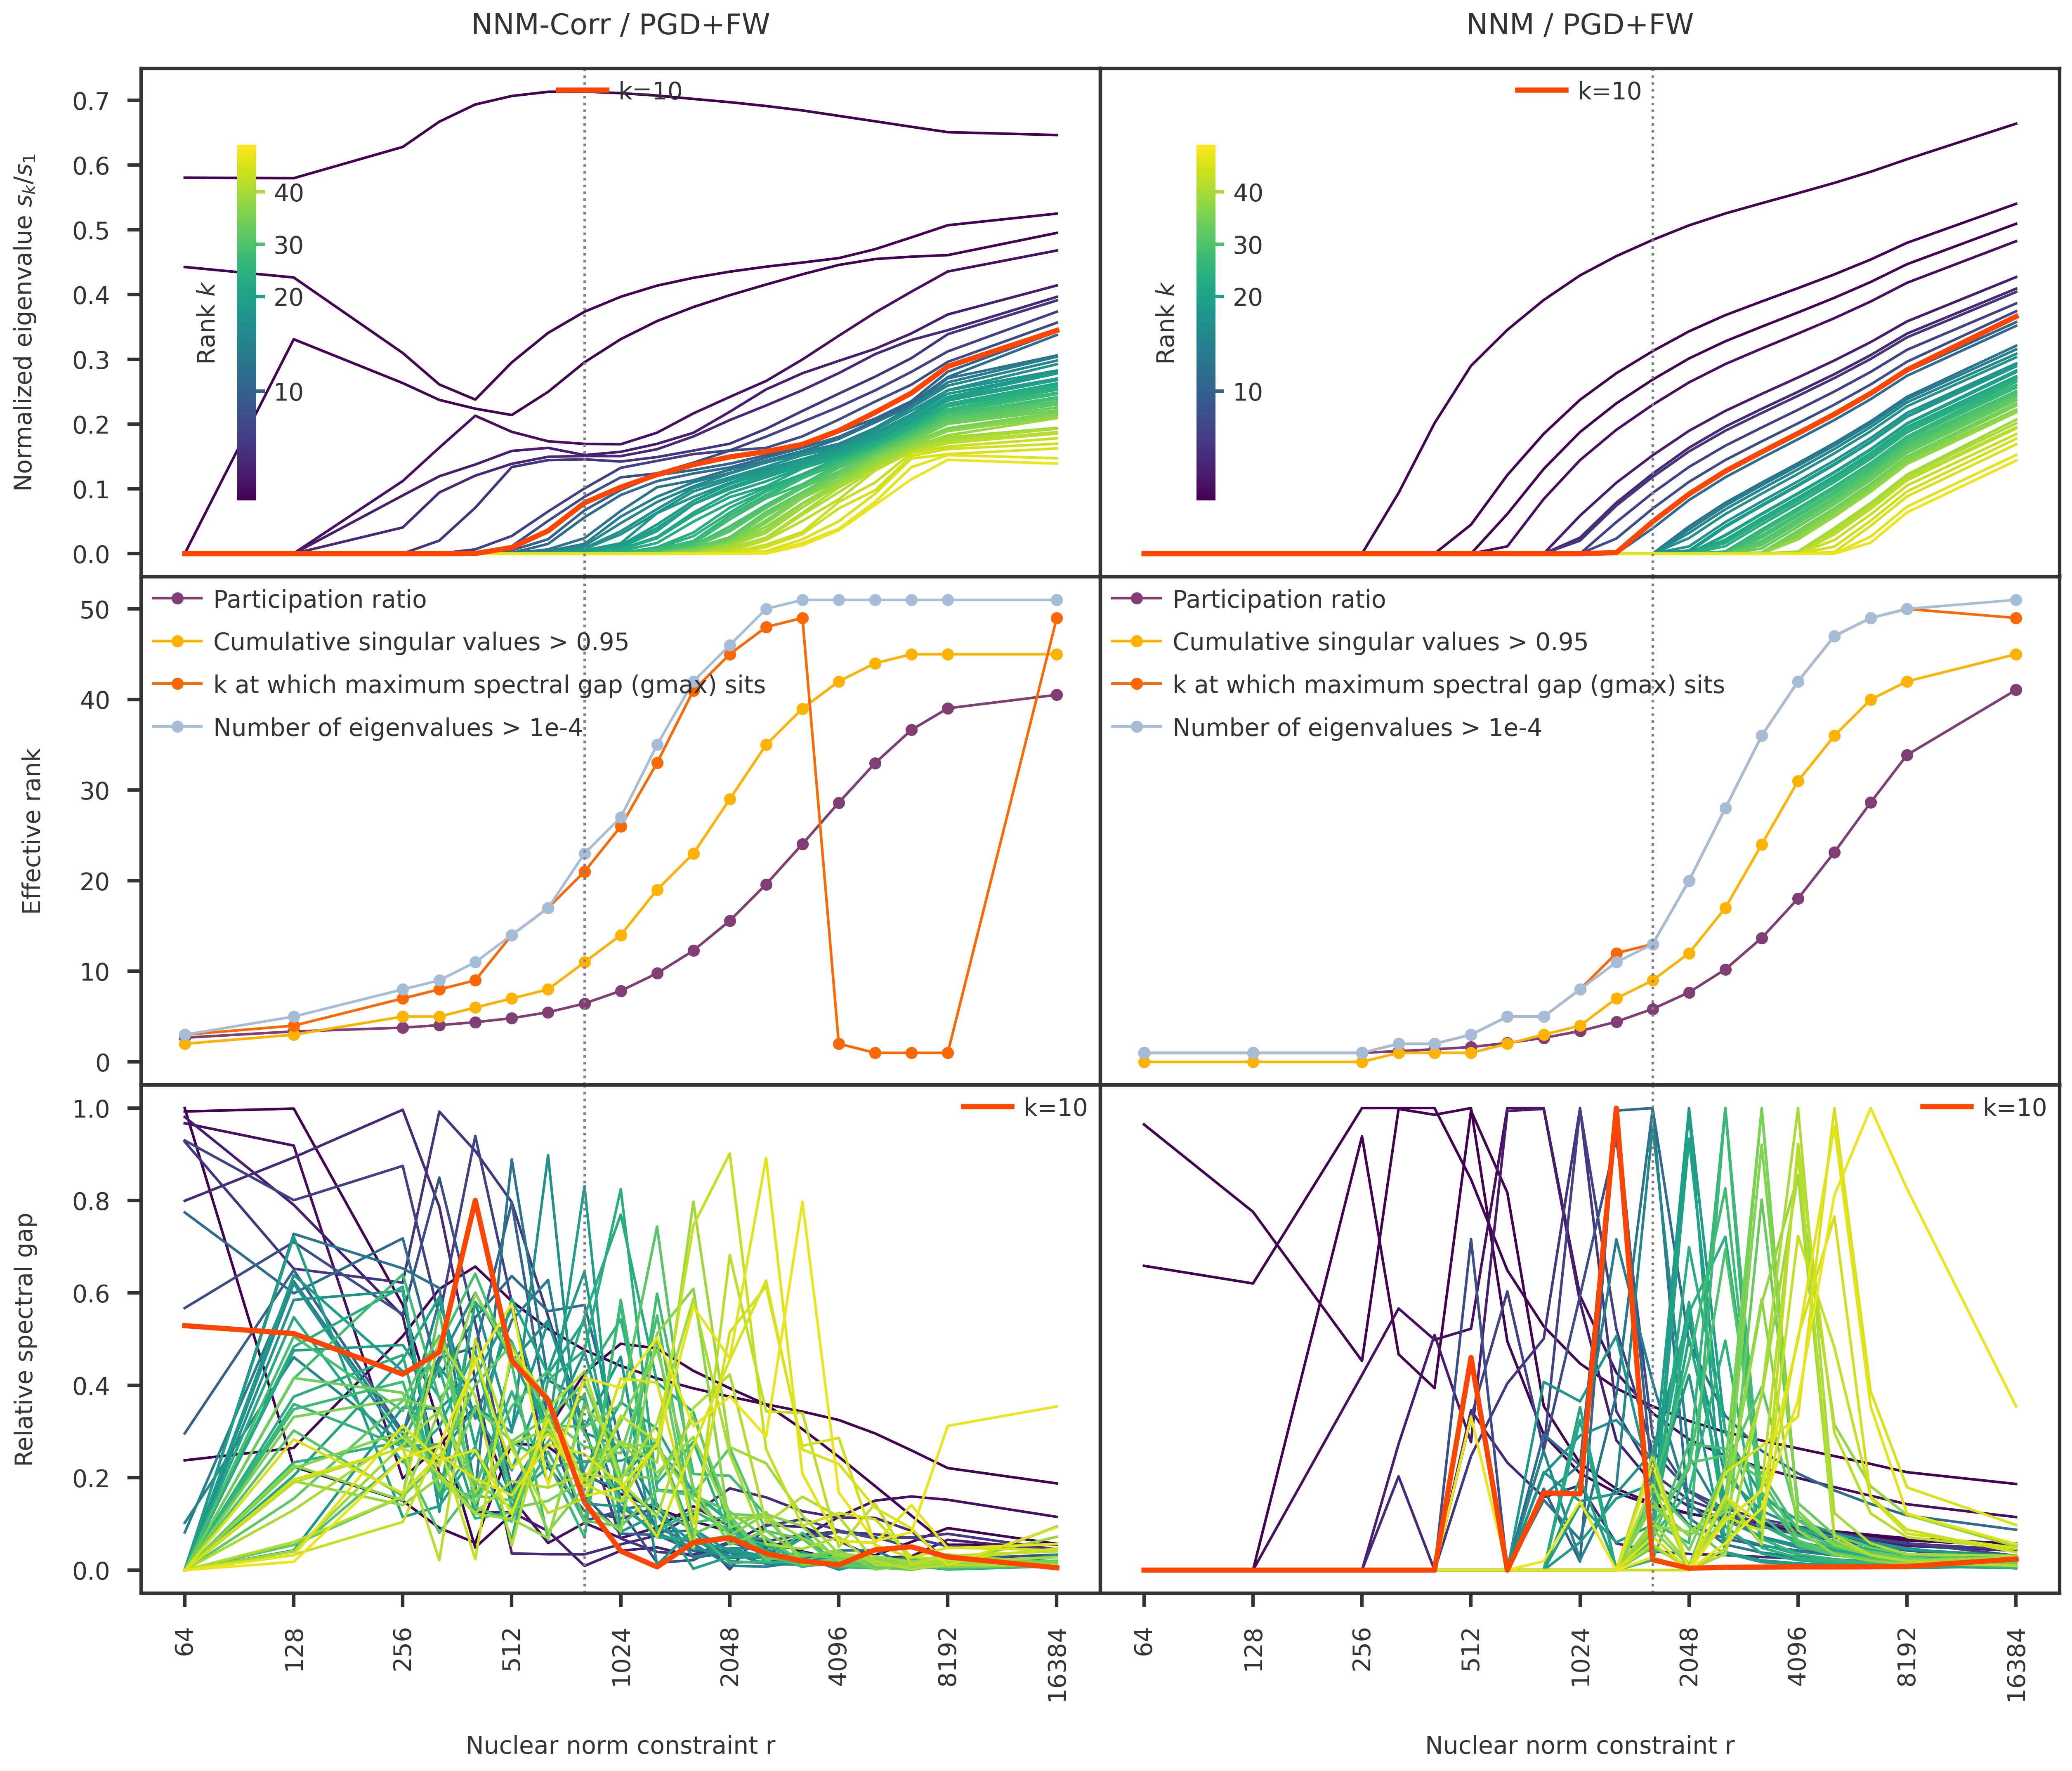
def make_singular_value_plots(ax1, ax2, ax3, prefix, 
        svd_out_dir, r_scale='log10', show_yaxis=True, k_max=65,
        k_highlight=20, r_choose=None):
    # load data 
    df          = load_svd_npz(svd_out_dir, prefix)   
    nucnorms    = df["nucnorm"].to_numpy(dtype=float)
    
    # common x-axis for all plots
    x, xticks, xlabels  = get_r_scaled(nucnorms, scale=r_scale)
    ylabel=""
    
    # -- ax1: fan of normalized singular values --
    k_list = np.arange(2, k_max)
    k_center = 15
    y = get_singular_value_metrics(df, k_list, metric="norm_value")
    show_cbar = True
    if show_yaxis: 
        # show_cbar = True
        ylabel=r"Normalized eigenvalue $s_k / s_1$"
    cmap, norm = make_line_plots_with_colorbar_inset(
        ax1, x, y, k_list,
        show_cbar=show_cbar,
        ylabel=ylabel, cbar_label=r"Rank $k$", cbar_xpos=0.1,
        vcenter=k_center)
    ax1.plot(x, y[:, k_highlight-1], color='orangered', lw=3, label=f"k={k_highlight:d}")
    ax1.legend(frameon = False, handlelength = 2, loc='upper center')
    
    # -- ax2: effective ranks --
    rank_methods = {
        "participation_ratio": 
            {"thres": None, "label": "Participation ratio"}, 
        "energy": 
            {"thres": 0.95, "label": f"Cumulative singular values > 0.95"}, 
        "spectral_gap": 
            {"thres": None, "label": "k at which maximum spectral gap (gmax) sits"},
        "count": 
            {"thres": 1e-4, "label": "Number of eigenvalues > 1e-4"},
        "spectral_gap_loose":
            {"thres": 0.7,  "label": "Max k at which spectral gap > 70% gmax"},
    }
    ranks = {}
    rank_lines = {}
    for m, mdict in rank_methods.items():
        ranks[m] = get_effective_ranks(df, nucnorms, method=m, thres=mdict["thres"])
        if m != "spectral_gap_loose":
            rank_lines[m], = ax2.plot(x, ranks[m],  'o-', label=mdict["label"])

    if show_yaxis: 
        ylabel="Effective rank"
    ax2.legend(frameon = False, handlelength = 2)
    ax2.set_ylabel(ylabel)
    
    # -- ax3: relative spectral gap --
    # k_list = [8, 10, 12, 15, 20, 25, 30, 40]
    y = get_singular_value_metrics(df, k_list, metric="relative_gap")       
    for i, k in enumerate(k_list):
        # ax3.plot(x, y[:, i], 'o-', label=f"{k}")
        ax3.plot(x, y[:, i], color=cmap(norm(i)))
    ax3.plot(x, y[:, k_highlight-1], color='orangered', lw=3, label=f"k={k_highlight:d}")
    if show_yaxis:
        ylabel=r"Relative spectral gap"
    ax3.legend(frameon = False, handlelength = 2)
    ax3.set_ylabel(ylabel)
    
    # -- mark the chosen rank --
    if r_choose is not None:
        r_choose_idx = np.argwhere(nucnorms == r_choose)
        for ax in [ax1, ax2, ax3]:
            ax.axvline(x=x[r_choose_idx], color='grey', linestyle='dotted')

    
    # -- mark the x-axis --
    ax3.set_xticks(xticks)
    ax3.set_xticklabels(xlabels, rotation=90)
    ax3.set_xlabel("Nuclear norm constraint r")
    return
Code
def make_svd_spectrum_figure(svd_out_dir,
        nnm_r_choose=8192,
        nnm_corr_r_choose=2580,
        k_highlight=30, k_max=65, save_figure=True,
        file_out_suffix=""):

    fig = plt.figure(figsize=(20, 16))
    gs = fig.add_gridspec(nrows=3, ncols=2, wspace=0, hspace=0)

    ax1 = fig.add_subplot(gs[0, 0])
    ax2 = fig.add_subplot(gs[1, 0])
    ax3 = fig.add_subplot(gs[2, 0])
    ax4 = fig.add_subplot(gs[0, 1], sharey=ax1)
    ax5 = fig.add_subplot(gs[1, 1], sharey=ax2)
    ax6 = fig.add_subplot(gs[2, 1], sharey=ax3)

    for ax in (ax1, ax2, ax3, ax4, ax5, ax6):
        style_blank_axis(ax)
        ax.patch.set_alpha(0.0)
    for ax in (ax1, ax2, ax3):
        ax.tick_params(left=True, labelleft=True)
    for ax in (ax3, ax6):
        ax.tick_params(bottom=True, labelbottom=True)

    prefix1 = "pgd_fw_nnm_corr"
    make_singular_value_plots(
        ax1, ax2, ax3, 
        prefix1, svd_out_dir, 
        r_scale='log2', 
        k_highlight=k_highlight,
        r_choose=nnm_corr_r_choose,
        k_max=k_max,
    )
    ax1.set_title("NNM-Corr / PGD+FW", pad=20)

    prefix2 = "pgd_fw_nnm"
    make_singular_value_plots(
        ax4, ax5, ax6, 
        prefix2, svd_out_dir, 
        r_scale='log2', show_yaxis=False, 
        k_highlight=k_highlight,
        r_choose=nnm_r_choose,
        k_max=k_max,
    )
    ax4.set_title("NNM / PGD+FW", pad=20)

    outfile_name=f"figures/pgc_singular_value_spectrum_{file_out_suffix}"
    plt.savefig(f"{outfile_name}.pdf", bbox_inches='tight')
    plt.savefig(f"{outfile_name}.png", bbox_inches='tight')
    plt.show()

107 traits

Code
data_name="107 traits"
data_root=trait_dirs[data_name]

make_svd_spectrum_figure(Path(data_root) / "svd",
        k_highlight=int(rank_df.loc[data_name]["k"]),
        nnm_r_choose=rank_df.loc[data_name]["NNM"],
        nnm_corr_r_choose=rank_df.loc[data_name]["NNM-Corr"],
        k_max=65, save_figure=True,
        file_out_suffix="v1_0")

78 traits (excluding “Biomarkers”)

Code
data_name="78 traits"
data_root=trait_dirs[data_name]

make_svd_spectrum_figure(Path(data_root) / "svd",
        k_highlight=int(rank_df.loc[data_name]["k"]),
        nnm_r_choose=rank_df.loc[data_name]["NNM"],
        nnm_corr_r_choose=rank_df.loc[data_name]["NNM-Corr"],
        k_max=65, save_figure=True,
        file_out_suffix="v1_1")

51 traits (excluding “Biomarker” and “Neurite density” traits)

Code
data_name="51 traits"
data_root=trait_dirs[data_name]

make_svd_spectrum_figure(Path(data_root) / "svd",
        k_highlight=int(rank_df.loc[data_name]["k"]),
        nnm_r_choose=rank_df.loc[data_name]["NNM"],
        nnm_corr_r_choose=rank_df.loc[data_name]["NNM-Corr"],
        k_max=50, save_figure=True,
        file_out_suffix="v1_2")

Code
prefix   = "pgd_fw_nnm_corr"

rank_methods = {
    "participation_ratio": 
        {"thres": None, "label": "Participation ratio"}, 
    "energy": 
        {"thres": 0.95, "label": f"Cumulative singular values > 0.95"}, 
    "spectral_gap": 
        {"thres": None, "label": "k at which maximum spectral gap (gmax) sits"},
    "count": 
        {"thres": 1e-4, "label": "Number of eigenvalues > 1e-4"},
    "spectral_gap_loose":
        {"thres": 0.7,  "label": "Max k at which spectral gap > 70% gmax"},
}

from IPython.display import display, HTML

for data_name, data_root in trait_dirs.items():
    svd_out_dir = Path(data_root) / "svd"
    df = load_svd_npz(svd_out_dir, prefix)
    r_choose = rank_df.loc[data_name]["NNM-Corr"]

    rows = dict()
    for m, mdict in rank_methods.items():
        rank = get_effective_rank_at_nucnorm(df, r_choose, thres=mdict["thres"], method=m)
        label = f"{mdict['label']}"
        rows[label] = {"Effective Rank": rank}
    print(f"{data_name} | Threshold r = {r_choose:g}")
    display(pd.DataFrame(rows).T.style.format({"Effective Rank": "{:g}"}))
    # display(HTML(pd.DataFrame(rows).T.to_html()))
107 traits | Threshold r = 2580
  Effective Rank
Participation ratio 20.4139
Cumulative singular values > 0.95 31
k at which maximum spectral gap (gmax) sits 43
Number of eigenvalues > 1e-4 46
Max k at which spectral gap > 70% gmax 46
78 traits | Threshold r = 1024
  Effective Rank
Participation ratio 18.7438
Cumulative singular values > 0.95 25
k at which maximum spectral gap (gmax) sits 32
Number of eigenvalues > 1e-4 33
Max k at which spectral gap > 70% gmax 34
51 traits | Threshold r = 813
  Effective Rank
Participation ratio 6.44503
Cumulative singular values > 0.95 11
k at which maximum spectral gap (gmax) sits 21
Number of eigenvalues > 1e-4 23
Max k at which spectral gap > 70% gmax 21