Code
import numpy as npimport pandas as pdimport pickleimport osfrom scipy import stats as sc_statsfrom scipy.cluster import hierarchy as sp_hierarchyimport matplotlib.pyplot as pltfrom pymir import mpl_stylesheetfrom pymir import mpl_utils= 'black' , dpi = 120 , colors = 'kelly' )from matplotlib.gridspec import GridSpecfrom nnwmf.optimize import IALMfrom nnwmf.optimize import FrankWolfe, FrankWolfe_CVfrom nnwmf.utils import model_errors as merrimport sys"../utils/" )import histogram as mpy_histogramimport simulate as mpy_simulateimport plot_functions as mpy_plotfn
Code
= "/gpfs/commons/home/sbanerjee/work/npd/PanUKB/data" = f" { data_dir} /GWAS_Zscore.tsv" = f" { data_dir} /trait_manifest_TableS6_no_readme.tsv" = f" { data_dir} /allvar.pruned.closesttss.hugo" = pd.read_csv(zscore_filename, sep = ' \t ' )= pd.read_csv(trait_filename, sep = ' \t ' )= pd.read_csv(variant_filename, sep = ' \t ' )# remove extra columns from trait_df = trait_df.columns.tolist()0 ] = "zindex" = colnames= trait_df.drop(labels = ['coding' , 'modifier' , 'coding_description' , 'filename' , 'aws_link' ], axis= 1 )#trait_df_mod
Code
0
1
icd10
A04
both_sexes
A04 Other bacterial intestinal infections
truncated: true
Chapter I Certain infectious and parasitic dis...
BIN
3088
417443.0
420531
6130.649032
0.0033
1
2
icd10
A08
both_sexes
A08 Viral and other specified intestinal infec...
truncated: true
Chapter I Certain infectious and parasitic dis...
BIN
1107
419424.0
420531
2208.171897
0.0001
2
3
icd10
A09
both_sexes
A09 Diarrhoea and gastro-enteritis of presumed...
truncated: true
Chapter I Certain infectious and parasitic dis...
BIN
9029
411502.0
420531
17670.286180
0.0035
3
4
icd10
A41
both_sexes
A41 Other septicaemia
truncated: true
Chapter I Certain infectious and parasitic dis...
BIN
5512
415019.0
420531
10879.505810
0.0011
4
5
icd10
B34
both_sexes
B34 Viral infection of unspecified site
truncated: true
Chapter I Certain infectious and parasitic dis...
BIN
2129
418402.0
420531
4236.443249
0.0003
...
...
...
...
...
...
...
...
...
...
...
...
...
...
2478
2479
continuous
Smoking
both_sexes
Smoking status, ever vs never
Ever (previous + current smoker) vs never base...
NaN
QT
418817
NaN
418817
418817.000000
0.1100
2479
2480
continuous
eGFR
both_sexes
Estimated glomerular filtration rate, serum cr...
eGFR based on serum creatinine (30700) using t...
NaN
QT
401867
NaN
401867
401867.000000
0.2070
2480
2481
continuous
eGFRcreacys
both_sexes
Estimated glomerular filtration rate, cystain C
eGFR based on cystain C (30720) using the CKD-...
NaN
QT
401570
NaN
401570
401570.000000
0.2380
2481
2482
continuous
eGFRcys
both_sexes
Estimated glomerular filtration rate, serum cr...
eGFR based on serum creatinine (30700) and cys...
NaN
QT
402031
NaN
402031
402031.000000
0.2240
2482
2483
continuous
whr
both_sexes
pheno 48 / pheno 49
NaN
NaN
QT
420531
NaN
420531
420531.000000
0.1740
2483 rows × 13 columns
0
rs6657440
-0.903532
0.561842
0.711068
-0.109174
0.223668
-1.728199
0.374988
-0.265971
-2.823282
...
1.521092
0.612532
1.405428
0.018029
0.895337
-0.008761
-2.069432
-4.292948
-4.701711
2.952899
1
rs7418179
0.398166
1.163539
0.512118
0.144794
-1.313903
-1.547410
0.450270
0.560324
-1.502268
...
-0.296537
-0.734266
-0.093081
0.412077
1.961159
0.716049
-2.171984
-5.314085
-6.612137
3.817518
2
rs80125161
-1.739115
-0.172328
0.349145
-0.329335
-0.870640
-1.004155
1.128148
0.151244
-1.816075
...
2.222433
1.092969
2.328233
1.160767
0.909524
-1.467249
-0.135785
-2.187241
-3.223529
4.508578
3
rs7524174
-0.884478
-1.762000
1.312823
-0.550764
2.132540
0.519828
0.834194
0.699441
-0.885281
...
3.356354
1.990588
3.092179
-0.133810
-0.072845
-1.376310
1.317044
0.913491
0.535188
2.245657
4
rs3829740
-1.469931
-0.519628
-0.281605
-0.267729
-1.060167
0.058116
-0.638319
-0.589767
0.228514
...
-0.320075
-0.128047
-0.524757
-0.232900
-1.051020
-0.483644
2.026508
4.400092
5.407316
1.125536
...
...
...
...
...
...
...
...
...
...
...
...
...
...
...
...
...
...
...
...
...
...
51394
rs9616937
-0.211947
1.371231
-1.800776
0.609980
-0.619822
0.947269
-1.166021
0.478601
-0.359714
...
0.714167
0.354347
0.611158
-0.354725
1.073043
-0.831737
0.870924
1.432076
2.228501
0.536104
51395
rs1024374
0.027097
-1.817082
0.530216
0.813498
-0.076514
0.784427
1.411160
-1.111740
-0.224438
...
1.107098
1.482684
1.512723
0.322355
-0.374603
1.320194
-0.700092
-1.395039
-2.270186
0.360025
51396
rs144480800
0.545682
0.391830
0.520505
-1.280976
0.453876
-1.388940
0.025094
0.737788
1.178641
...
-0.562063
-1.148515
-0.994185
-0.268232
-0.069619
0.013256
-0.777667
-1.544760
-1.406344
2.205817
51397
rs5770994
1.441851
1.152368
-1.500000
-0.468137
-0.444156
-0.780139
-0.853550
-0.316097
0.311219
...
-1.185702
-0.624073
-0.859522
0.549669
1.809912
0.268733
0.947441
1.533302
1.658537
2.218653
51398
rs9616824
0.669372
-0.308184
-0.811311
-0.154224
1.476823
0.065167
-1.030063
-0.215723
-0.631385
...
0.308486
0.612102
0.492977
-0.621278
-2.657386
-0.732402
-0.106474
-0.029006
0.070647
-0.805253
51399 rows × 2484 columns
Save the full data
Code
= np.array(zscore_df.drop(labels = ['rsid' ], axis = 1 ).values.T)= X - np.mean(X, axis = 0 , keepdims = True )print (f"We have { X_cent. shape[0 ]} samples (phenotypes) and { X_cent. shape[1 ]} features (variants)" )print (f"Fraction of Nan entries: { np. sum (np.isnan(X)) / np. prod(X_cent.shape):.3f} " )= os.path.join(data_dir, f"modselect/zscore_all.pkl" )= os.path.join(data_dir, f"modselect/traits_all.pkl" )# zscore_df.to_pickle(zscore_df_filename) # trait_df.to_pickle(trait_df_filename)
We have 2483 samples (phenotypes) and 51399 features (variants)
Fraction of Nan entries: 0.000
Selection for matrix completion benchmark
Code
= 0.1 = 5e-8 = trait_df_mod[trait_df_mod['estimates.final.h2_observed' ] > h2_cut]= trait_df_selected['zindex' ].values= ['rsid' ] + [f'z { x} ' for x in zidx_selected]= zscore_df[colnames_selected]= sc_stats.norm.ppf(1 - (pval_cut / 2 ))= []for x in zidx_selected:+= zscore_df_selected[zscore_df_selected[f'z { x} ' ].abs () > zcut].index.to_list()= sorted (set (rsid_idx_selected))= zscore_df_selected.iloc[rsid_idx_selected, :].drop(labels = ['rsid' ], axis = 1 )
Code
= np.array(zscore_df_selected.values.T)= X - np.mean(X, axis = 0 , keepdims = True )print (f"We have { X_cent. shape[0 ]} samples (phenotypes) and { X_cent. shape[1 ]} features (variants)" )print (f"Fraction of Nan entries: { np. sum (np.isnan(X)) / np. prod(X_cent.shape):.3f} " )
We have 216 samples (phenotypes) and 48212 features (variants)
Fraction of Nan entries: 0.000
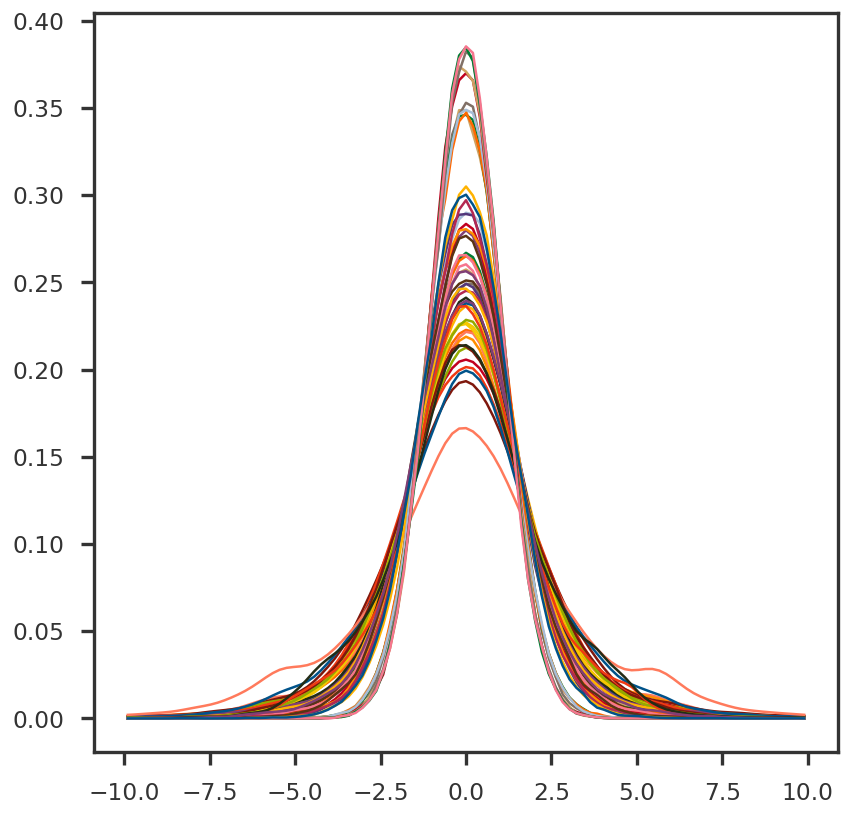
Code
def get_density(x, data):= sc_stats.gaussian_kde(data)return density.pdf(x)def get_bins(data, nbin, xmin, xmax):= (np.max (data) - np.min (data)) / 10 if not xmin: xmin = np.min (data) - xdeltaif not xmax: xmax = np.max (data) + xdelta= np.linspace(xmin, xmax, nbin)= [(bins[i] + bins[i+ 1 ]) / 2 for i in range (bins.shape[0 ] - 1 )] # centers of the bins return xmin, xmax, bins, xbin= plt.figure()= fig.add_subplot(111 )for n in range (50 ):= X_cent[n, :]= get_bins(scores_cent, 100 , - 10 , 10 )= get_density(xbin, scores_cent)
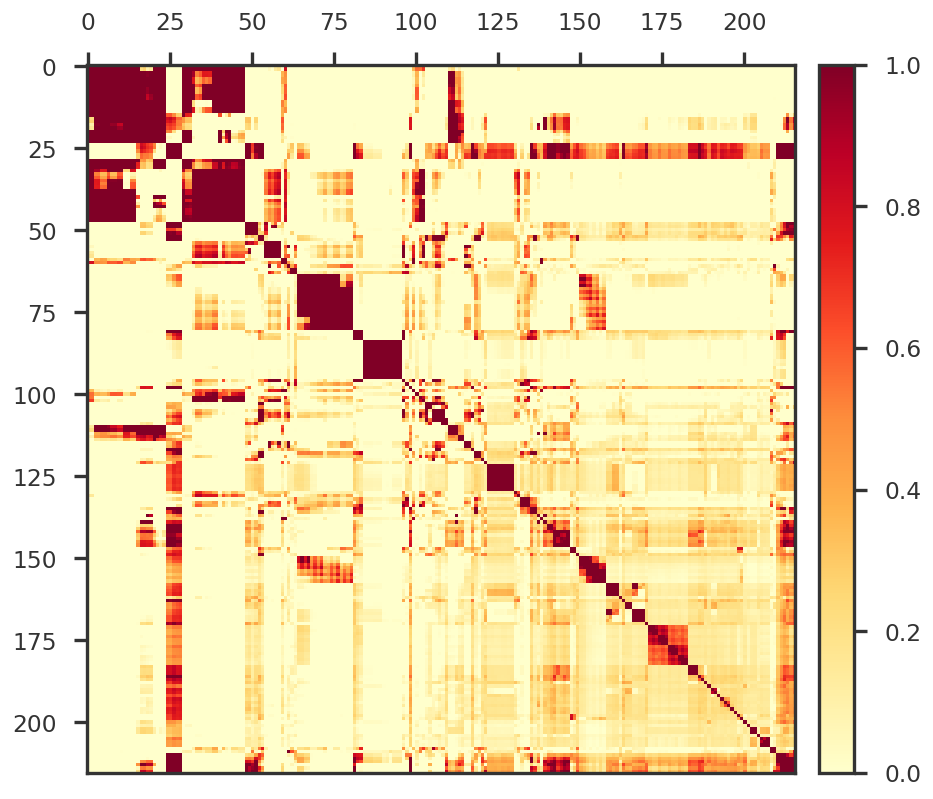
Hierarchical clustering of covariance matrix
Code
from scipy.cluster import hierarchy as sp_hierarchy= np.cov(X_cent)= sp_hierarchy.leaves_list(sp_hierarchy.linkage(sample_distance_matrix, method = 'centroid' ))= plt.figure(figsize = (8 , 8 ))= fig.add_subplot(111 )#mpy_plotfn.plot_covariance_heatmap(ax1, Z * np.sqrt(p) / np.sqrt(nsample))
Save the dataframes
Code
= os.path.join(data_dir, f"modselect/zscore_h2 { h2_cut} _pval { pval_cut} .pkl" )= os.path.join(data_dir, f"modselect/traits_h2 { h2_cut} .pkl" )# zscore_df_selected.to_pickle(zscore_df_selected_filename) # trait_df_selected.to_pickle(trait_df_selected_filename)
Code
0
3.591973
-0.038545
4.356103
-0.030974
-2.625193
-0.082182
-1.513514
2.927977
1.145769
-0.924589
...
-0.964337
1.521092
0.612532
1.405428
0.018029
-0.008761
-2.069432
-4.292948
-4.701711
2.952899
1
2.690253
2.060959
5.074098
2.131896
-2.200532
0.203585
0.053289
2.081926
1.606040
-0.265317
...
-0.158982
-0.296537
-0.734266
-0.093081
0.412077
0.716049
-2.171984
-5.314085
-6.612137
3.817518
2
4.672697
1.966395
6.363325
1.017074
-3.506709
-0.985765
-0.432902
2.834796
3.055340
-2.151471
...
0.716255
2.222433
1.092969
2.328233
1.160767
-1.467249
-0.135785
-2.187241
-3.223529
4.508578
3
3.628734
0.377612
1.851399
-1.249221
-1.881565
-0.479096
-1.015920
0.498607
-0.294269
-1.046150
...
-1.404276
3.356354
1.990588
3.092179
-0.133810
-1.376310
1.317044
0.913491
0.535188
2.245657
4
-0.858911
-0.623239
-1.686601
-3.003435
0.532031
-0.341693
-3.777505
0.254496
0.226082
-0.322407
...
-0.536635
-0.320075
-0.128047
-0.524757
-0.232900
-0.483644
2.026508
4.400092
5.407316
1.125536
...
...
...
...
...
...
...
...
...
...
...
...
...
...
...
...
...
...
...
...
...
...
51394
1.342127
1.797208
-0.979370
-1.867291
0.037906
-1.162637
-3.256483
2.176569
-1.732998
-0.328859
...
0.482023
0.714167
0.354347
0.611158
-0.354725
-0.831737
0.870924
1.432076
2.228501
0.536104
51395
-1.244520
-1.527636
1.849772
2.144946
-0.031816
2.274951
2.456148
-2.560491
-0.212461
0.982478
...
-0.110369
1.107098
1.482684
1.512723
0.322355
1.320194
-0.700092
-1.395039
-2.270186
0.360025
51396
-0.253862
0.812630
-0.711050
1.179577
-2.862653
-2.013295
2.833169
0.153290
2.138158
-2.653582
...
-0.088946
-0.562063
-1.148515
-0.994185
-0.268232
0.013256
-0.777667
-1.544760
-1.406344
2.205817
51397
-0.915597
1.668377
-0.823597
0.163447
-0.061726
0.319698
0.922030
2.559199
0.215736
0.468609
...
0.098326
-1.185702
-0.624073
-0.859522
0.549669
0.268733
0.947441
1.533302
1.658537
2.218653
51398
1.047521
-0.022502
2.343549
-0.933287
1.285805
-1.105163
0.234492
-0.452837
-0.142916
-0.777741
...
0.713318
0.308486
0.612102
0.492977
-0.621278
-0.732402
-0.106474
-0.029006
0.070647
-0.805253
48212 rows × 216 columns
MHC region (hg38)
Chromosome 6: 28510120 - 33480577
Code
'chr == 6 and 28510120 < pos < 33480577' )
Save all traits excluding prescriptions
Code
= zscore_df[[f'z { x} ' for x in trait_df.query('trait_type != "prescriptions"' )['zindex' ].values]]= zscore_df[[f'z { x} ' for x in trait_df.query('trait_type == "prescriptions"' )['zindex' ].values]]= np.array(zscore_df_Rx.values.T)= X_Rx - np.mean(X_Rx, axis = 0 , keepdims = True )= np.array(zscore_df_noRx.values.T)= X_noRx - np.mean(X_noRx, axis = 0 , keepdims = True )= plt.figure(figsize = (18 , 8 ))= fig.add_subplot(121 )= fig.add_subplot(122 )for n in range (50 ):= X_noRx[n, :]= get_bins(scores_cent, 100 , - 10 , 10 )= get_density(xbin, scores_cent)for n in range (50 ):= X_Rx[n, :]= get_bins(scores_cent, 100 , - 10 , 10 )= get_density(xbin, scores_cent)
Code
= 5e-8 = trait_df.query('trait_type != "prescriptions"' )= trait_df_noRx['zindex' ].values# from the zscore_df, select columns corresponding to _noRx traits = [f'z { x} ' for x in zidx_noRx]= zscore_df[colnames_noRx]# Remove SNPs which are not significant in at least one trait = sc_stats.norm.ppf(1 - (pval_cut / 2 ))= zscore_df_noRx[(zscore_df_noRx.abs () >= zcut).any (axis = 1 )]# Save the dataframes for next step = os.path.join(data_dir, f"modselect/zscore_noRx.pkl" )= os.path.join(data_dir, f"modselect/traits_noRx.pkl" )# zscore_df_noRx.to_pickle(zscore_df_noRx_filename) # trait_df_noRx.to_pickle(trait_df_noRx_filename)
Code
= pd.read_pickle(os.path.join(data_dir, f"modselect/zscore_all.pkl" ))= pd.read_pickle(os.path.join(data_dir, f"modselect/traits_all.pkl" ))
Code
<class 'pandas.core.frame.DataFrame'>
RangeIndex: 51399 entries, 0 to 51398
Columns: 2484 entries, rsid to z2483
dtypes: float64(2483), object(1)
memory usage: 974.1+ MB
Code
<class 'pandas.core.frame.DataFrame'>
RangeIndex: 2483 entries, 0 to 2482
Data columns (total 18 columns):
 #   Column                       Non-Null Count  Dtype
---  ------                       --------------  -----
 0   zindex                       2483 non-null   int64
 1   trait_type                   2483 non-null   object
 2   phenocode                    2483 non-null   object
 3   pheno_sex                    2483 non-null   object
 4   coding                       267 non-null    object
 5   modifier                     394 non-null    object
 6   description                  2110 non-null   object
 7   description_more             1408 non-null   object
 8   coding_description           261 non-null    object
 9   category                     2304 non-null   object
 10  BIN_QT                       2483 non-null   object
 11  n_cases_EUR                  2483 non-null   int64
 12  n_controls_EUR               1677 non-null   float64
 13  N                            2483 non-null   int64
 14  Neff                         2483 non-null   float64
 15  filename                     2483 non-null   object
 16  aws_link                     2483 non-null   object
 17  estimates.final.h2_observed  2305 non-null   float64
dtypes: float64(3), int64(3), object(12)
memory usage: 349.3+ KB