Comparison of LDSC slopes vs intercepts of neuropsychiatric traits

Author

Saikat Banerjee

Published

June 10, 2026

Abstract
This notebook looks at the design of the input. It compares the sample overlap with genetic correlation.

Background

If the intercept matrix and the slope matrix from LD score regression are themselves collinear across trait pairs, then “NNM tracks intercept, NNM-Corr tracks slope” is untestable, because the two targets aren’t separable.

Moreover, A^{-1} is built from the intercepts, so wherever sampling and genetic structure coincide, NNM-Corr is actively down-weighting directions that carry real genetic signal.

Code
import json
from pathlib import Path

import numpy as np
import pandas as pd

import matplotlib.pyplot as plt
from pymir import mpl_stylesheet
from pymir import mpl_utils
mpl_stylesheet.banskt_presentation(splinecolor='black', dpi=300, colors='kelly')

from matplotlib import colormaps as mpl_cmaps
import matplotlib.colors as mpl_colors
from mpl_toolkits.axes_grid1 import make_axes_locatable
Code
def normalize_trait_name(name):
    rename_map = {
        "Saxena": "Daytime_sleepiness",
    }
    if not isinstance(name, str):
        return name
    name = name.replace("-", "_")
    name = rename_map.get(name, name)
    return str(name)
    

def get_matrix_df_from_json(fpath, check_sanity=True):
    with open(Path(fpath), "r") as f:
        d = json.load(f)
    rows = []
    traits = []
    for a_vs_b, val in d.items():
        trait_a, trait_b = ([normalize_trait_name(x) for x in a_vs_b.split("_vs_")])
        traits.append(trait_a)
        traits.append(trait_b)
        rows.append({
            "trait_a": trait_a,
            "trait_b": trait_b,
            "rg": val,
        })
    traits = sorted(list(set(traits)))
    df = pd.DataFrame(rows)

    n = len(traits)
    R = pd.DataFrame(np.nan, index=traits, columns=traits, dtype=float)
    R.values[R.index.get_indexer(df["trait_a"]),
             R.columns.get_indexer(df["trait_b"])] = df["rg"].to_numpy()
    R.values[R.index.get_indexer(df["trait_b"]),
             R.columns.get_indexer(df["trait_a"])] = df["rg"].to_numpy()

    if check_sanity:
        # Max and min values
        print(f"max={R.max().max():.3g}, min={R.min().min():.3g}")
        # Symmetry sanity (in case the input accidentally contains BOTH directions)
        asym = np.nanmax(np.abs(R.values - R.values.T))
        print(f"max |R - R.T| = {asym:.3g}")   # expect 0.0 if each pair listed once
        
        # Coverage: how many off-diagonal pairs are actually populated?
        off = ~np.eye(len(traits), dtype=bool)
        print(f"populated off-diagonal fraction: {np.isfinite(R.values[off]).mean():.3f}")
        
    return R

Read data

Also do some basic sanity check.

Code
data_root="/gpfs/commons/home/sbanerjee/pgc/input"

R    = get_matrix_df_from_json(Path(data_root) / "ldsc_results/rg.txt")
R_se = get_matrix_df_from_json(Path(data_root) / "ldsc_results/rg_se.txt")
R_p  = get_matrix_df_from_json(Path(data_root) / "ldsc_results/rg_p.txt")

G    = get_matrix_df_from_json(Path(data_root) / "ldsc_results/gencov.txt")
G_se = get_matrix_df_from_json(Path(data_root) / "ldsc_results/gencov_se.txt")

S    = get_matrix_df_from_json(Path(data_root) / "ldsc_results/gcov_int.txt")
S_se = get_matrix_df_from_json(Path(data_root) / "ldsc_results/gcov_int_se.txt")

np.fill_diagonal(R.values, 1.0)

traits_meta_file = Path(data_root) / "trait_metadata.json"
with open(traits_meta_file , "r") as f:
    traits_meta = json.load(f)
max=3.87, min=-0.893
max |R - R.T| = 0
populated off-diagonal fraction: 0.949
max=10.8, min=0.00195
max |R - R.T| = 0
populated off-diagonal fraction: 0.949
max=0.999, min=0
max |R - R.T| = 0
populated off-diagonal fraction: 0.949
max=0.235, min=-0.104
max |R - R.T| = 0
populated off-diagonal fraction: 0.951
max=0.0508, min=0.0005
max |R - R.T| = 0
populated off-diagonal fraction: 0.951
max=1.4, min=-0.674
max |R - R.T| = 0
populated off-diagonal fraction: 0.951
max=0.0872, min=0.00397
max |R - R.T| = 0
populated off-diagonal fraction: 0.951

Plotting function and Spearman correlation to compare

Use Spearman correlation instead of Pearson correlation because we want to compare the rankings, not the absolute magnitudes.

Code
from scipy.stats import spearmanr, pearsonr
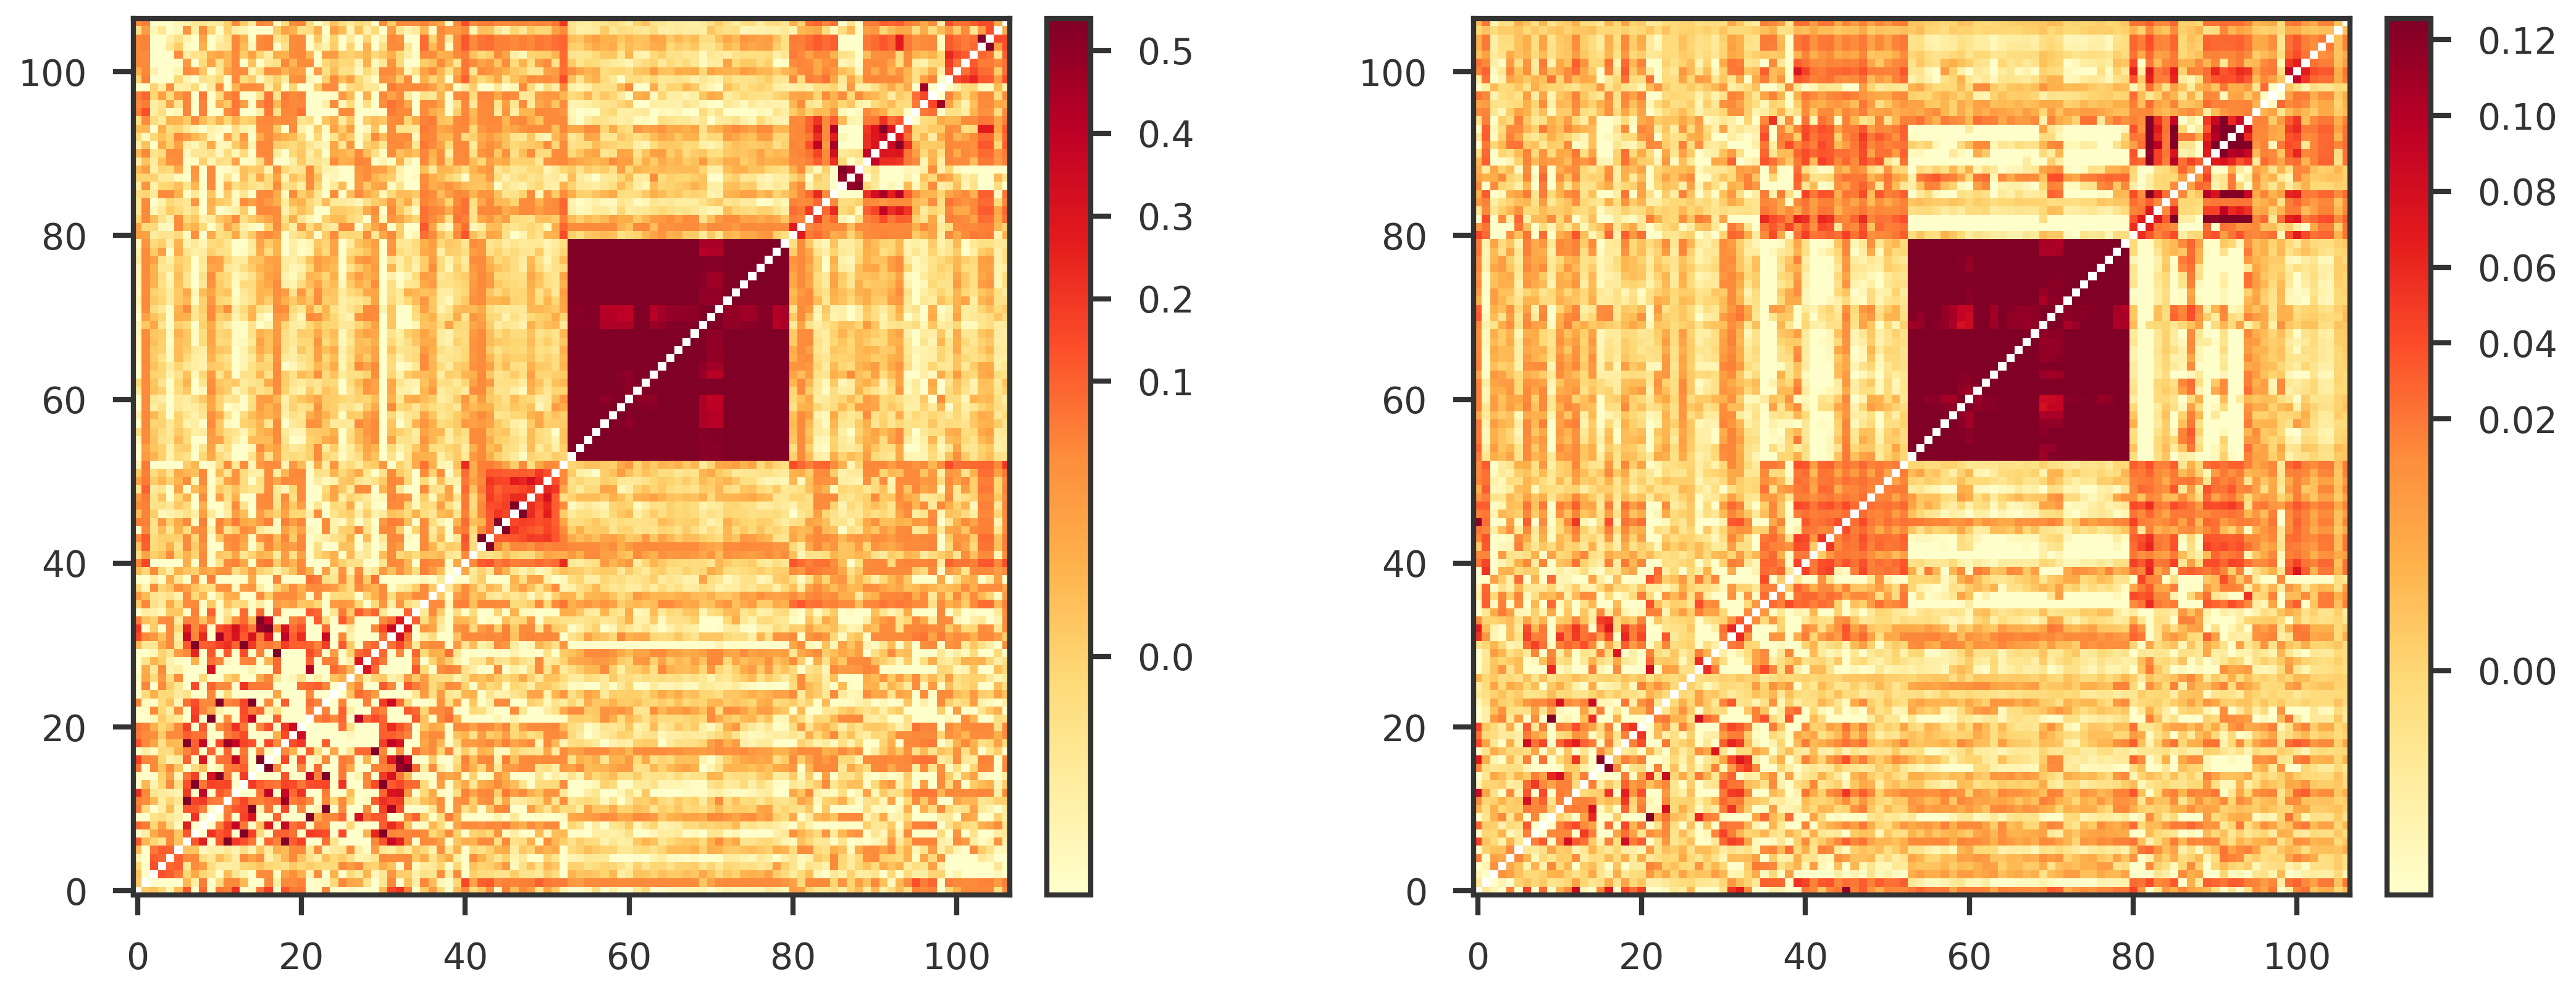
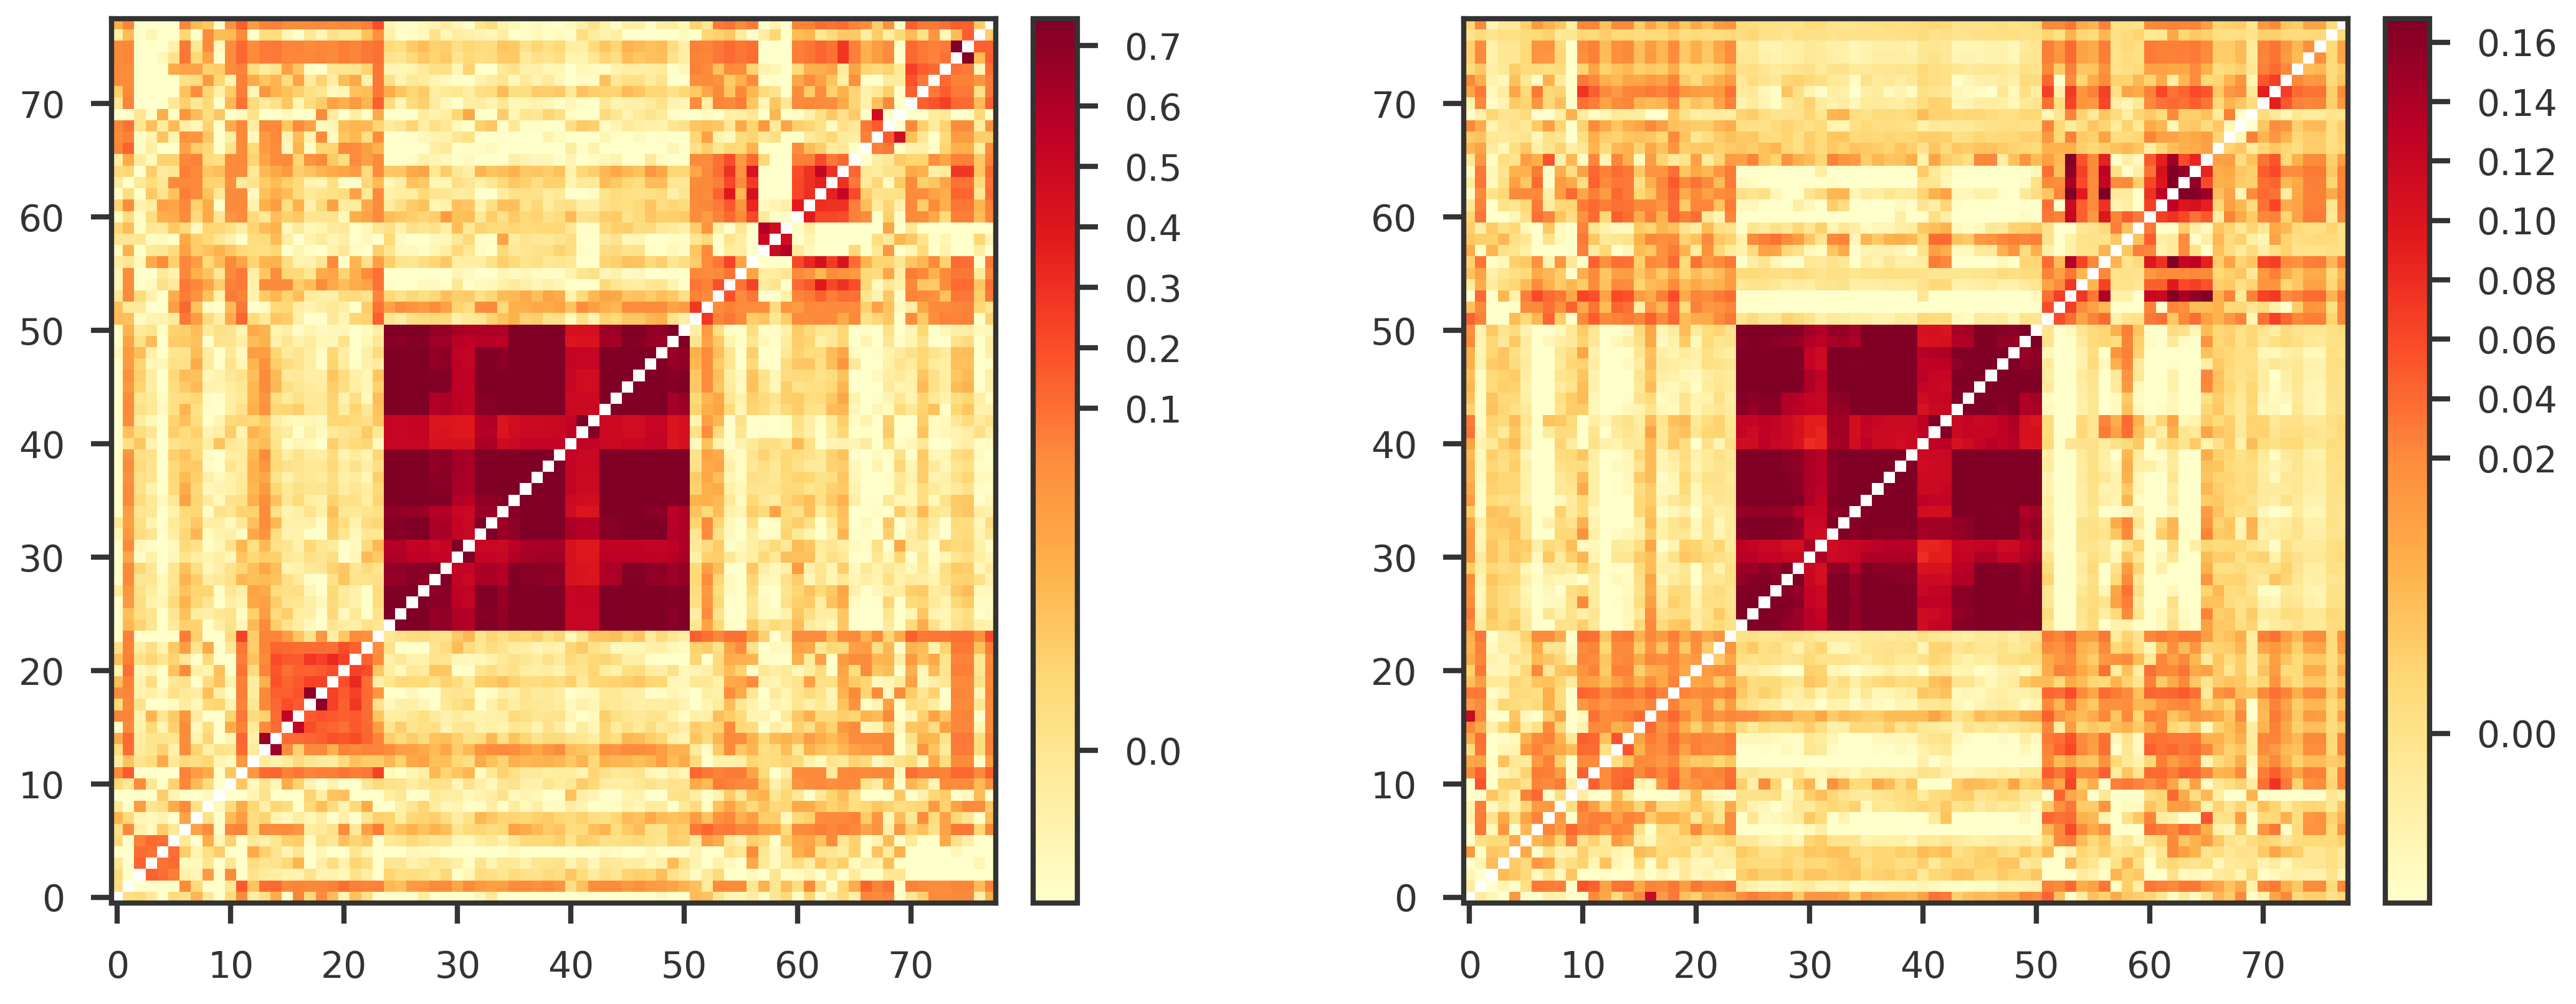
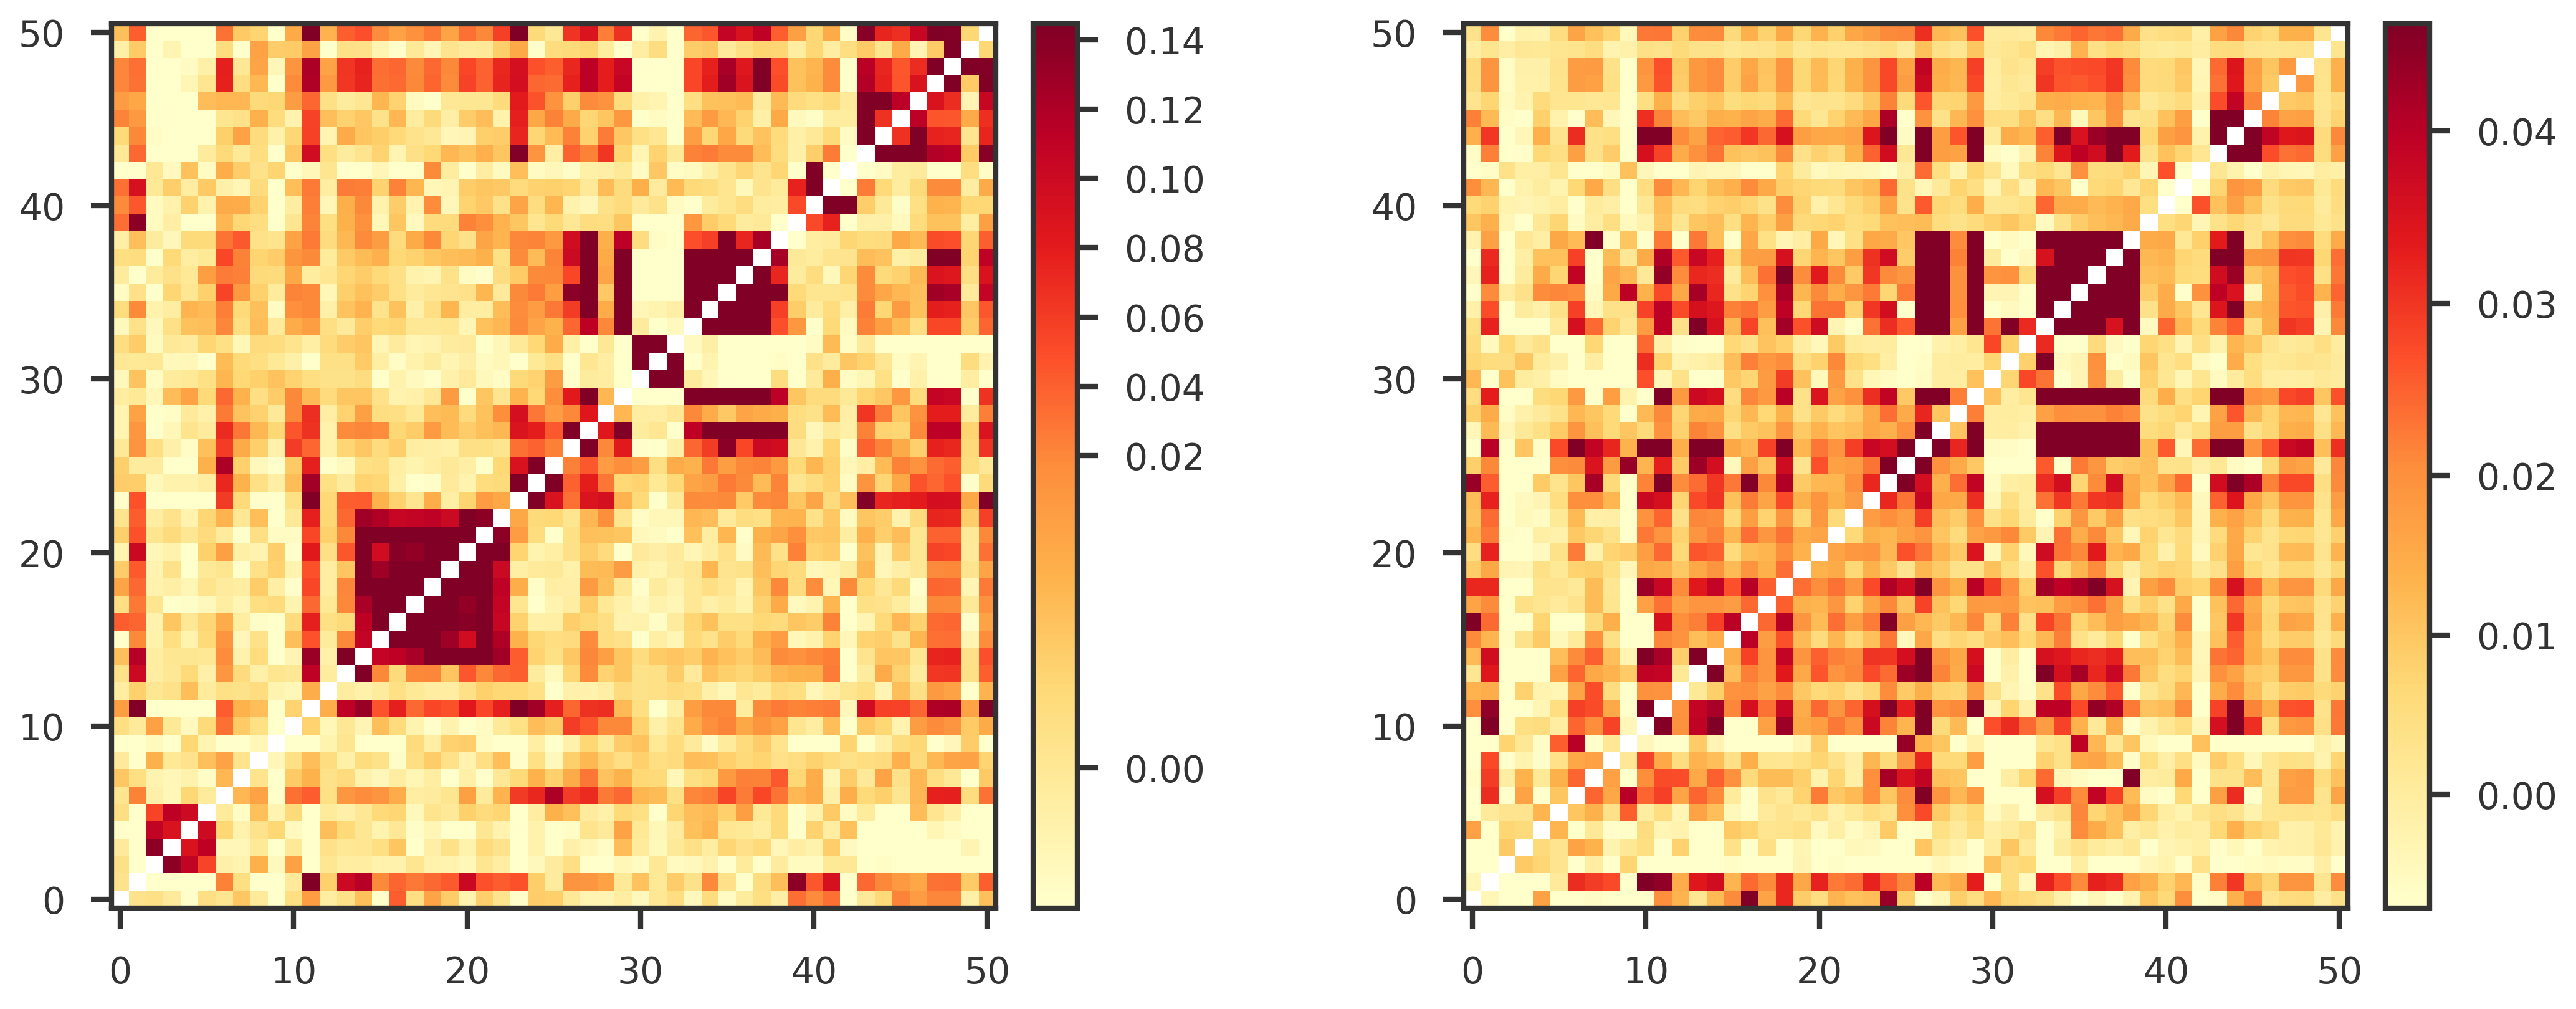
def make_heatmap_figure(A, B):
    
    def get_mpl_norm(X):
        ok = np.isfinite(X)
        vmin = np.quantile(X[ok], 0.1)
        vmax = np.quantile(X[ok], 0.95)
        vcenter = np.quantile(X[ok], 0.75)
        return mpl_colors.TwoSlopeNorm(vmin=vmin, vcenter=vcenter, vmax=vmax)
        
    
    A = A.to_numpy()
    B = B.to_numpy()
    
    fig = plt.figure(figsize = (16,8))
    gs  = fig.add_gridspec(nrows=1, ncols=2, wspace=0.4, hspace=0)
    ax1 = fig.add_subplot(gs[0, 0])
    ax2 = fig.add_subplot(gs[0, 1])

    cmap1 = mpl_cmaps.get_cmap("YlOrRd").copy()

    im1 = ax1.imshow(A, cmap=cmap1, norm=get_mpl_norm(A), origin='lower')
    divider = make_axes_locatable(ax1)
    cax = divider.append_axes("right", size="5%", pad=0.2)
    cbar = plt.colorbar(im1, cax=cax, fraction=0.1)

    im2 = ax2.imshow(B, cmap=cmap1, norm=get_mpl_norm(B), origin='lower')
    divider = make_axes_locatable(ax2)
    cax = divider.append_axes("right", size="5%", pad=0.2)
    cbar = plt.colorbar(im2, cax=cax, fraction=0.1)

    plt.show()

    
def offdiag_check(S, G, R, P, n_perm=10000, seed=0,thr=0.05):
    """
    S = bivariate intercept (sampling covariance)
    G = bivariate slope (genetic covariance)
    Off-diagonals only
    """
    S = np.asarray(S, float)
    G = np.asarray(G, float)
    R = np.asarray(R, float)
    P = np.asarray(P, float)
    iu = np.triu_indices_from(S, k=1)
    x, y, rg, rg_p = np.abs(S[iu]), G[iu], R[iu], P[iu]
    ok = np.isfinite(x) & np.isfinite(y) & np.isfinite(rg)
    x, y, rg, rg_p = x[ok], y[ok], rg[ok], rg_p[ok]
    r_obs = spearmanr(x, y).statistic       # rank -> robust to the two different scales


    for lo, hi in [(0, .05), (.05, .1), (.1, .2), (.2, .4), (.4, 2.01)]:
        m = (np.abs(x) >= lo) & (np.abs(x) < hi)
        if m.sum() > 5:
            # print(f"|Sampling Covariance| ∈ [{lo},{hi}):\tn={m.sum():5d}  ")
            print(f"|Sampling Covariance| ∈ [{lo:.2f},{hi:.2f})"
                  f"\n\tn = {m.sum():5d}"
                  f"\n\tρ = {spearmanr(x[m], y[m]).statistic:+.3f}"
                  f"\n\tmedian|rg| = {np.median(np.abs(rg[m])):.3f}"
                  f"\n\t95th|rg| = {np.quantile(np.abs(rg[m]),.95):.3f}"
                  f"\n\tfrac_sig = {np.mean(rg_p[m]<thr):.3f}")

    rng = np.random.default_rng(seed); n = S.shape[0]; null = np.empty(n_perm)
    for b in range(n_perm):
        p = rng.permutation(n)
        null[b] = spearmanr(S[np.ix_(p, p)][iu][ok], y).statistic
    p = (np.sum(np.abs(null) >= abs(r_obs)) + 1) / (n_perm + 1)
    
    return dict(spearman=r_obs, pearson=pearsonr(x, y)[0], mantel_p=p, x=x, y=y)

def load_zscore(zscore_path):
    df = pd.read_csv(Path(zscore_path), header=0, index_col=0, dtype={0: str})
    df.index = df.index.map(str)
    df.columns = df.columns.map(str)
    return df

107 traits

Code
Z = load_zscore(Path(data_root) / "pgc_v1.0/zscore_v1_0.csv")
trait_names = list(Z.index)

common_trait_names = sorted(
    trait_names,
    key=lambda trait: traits_meta[trait]['group']
)

S_107, G_107, R_107, R_p_107, S_se_107, G_se_107, R_se_107 = [
    df.loc[common_trait_names, common_trait_names]
    for df in (S, G, R, R_p, S_se, G_se, R_se)
]

make_heatmap_figure(S_107, G_107)
offdiag_check(S_107, G_107, R_107, R_p_107)

|Sampling Covariance| ∈ [0.00,0.05)
    n =  4841
    ρ = +0.103
    median|rg| = 0.063
    95th|rg| = 0.373
    frac_sig = 0.276
|Sampling Covariance| ∈ [0.05,0.10)
    n =   193
    ρ = +0.095
    median|rg| = 0.150
    95th|rg| = 0.771
    frac_sig = 0.782
|Sampling Covariance| ∈ [0.10,0.20)
    n =   169
    ρ = +0.119
    median|rg| = 0.224
    95th|rg| = 0.767
    frac_sig = 0.870
|Sampling Covariance| ∈ [0.20,0.40)
    n =    87
    ρ = +0.269
    median|rg| = 0.367
    95th|rg| = 1.111
    frac_sig = 0.989
|Sampling Covariance| ∈ [0.40,2.01)
    n =   381
    ρ = +0.825
    median|rg| = 0.804
    95th|rg| = 0.961
    frac_sig = 0.995
{'spearman': 0.3260796871672002,
 'pearson': 0.8993361068681656,
 'mantel_p': 9.999000099990002e-05,
 'x': array([0.001368  , 0.00216529, 0.0007015 , ..., 0.14691438, 0.14256507,
        0.00458009]),
 'y': array([-0.0037, -0.0076, -0.0311, ...,  0.0032,  0.014 ,  0.0025])}

78 traits

Code
Z = load_zscore(Path(data_root) / "pgc_v1.1/zscore_v1_1.csv")
trait_names = list(Z.index)

common_trait_names = sorted(
    trait_names,
    key=lambda trait: traits_meta[trait]['group']
)

S_78, G_78, R_78, R_p_78, S_se_78, G_se_78, R_se_78 = [
    df.loc[common_trait_names, common_trait_names]
    for df in (S, G, R, R_p, S_se, G_se, R_se)
]

make_heatmap_figure(S_78, G_78)
offdiag_check(S_78, G_78, R_78, R_p_78)

|Sampling Covariance| ∈ [0.00,0.05)
    n =  2453
    ρ = +0.183
    median|rg| = 0.087
    95th|rg| = 0.482
    frac_sig = 0.307
|Sampling Covariance| ∈ [0.05,0.10)
    n =    86
    ρ = +0.006
    median|rg| = 0.515
    95th|rg| = 0.854
    frac_sig = 0.977
|Sampling Covariance| ∈ [0.10,0.20)
    n =    70
    ρ = +0.088
    median|rg| = 0.538
    95th|rg| = 0.850
    frac_sig = 0.943
|Sampling Covariance| ∈ [0.20,0.40)
    n =    33
    ρ = +0.411
    median|rg| = 0.754
    95th|rg| = 1.196
    frac_sig = 1.000
|Sampling Covariance| ∈ [0.40,2.01)
    n =   361
    ρ = +0.903
    median|rg| = 0.807
    95th|rg| = 0.961
    frac_sig = 0.994
{'spearman': 0.5188576637631885,
 'pearson': 0.9415594245932898,
 'mantel_p': 9.999000099990002e-05,
 'x': array([0.001368  , 0.00216529, 0.0007015 , ..., 0.14691438, 0.14256507,
        0.00458009]),
 'y': array([-0.0037, -0.0076, -0.0311, ...,  0.0032,  0.014 ,  0.0025])}

51 traits

Code
Z = load_zscore(Path(data_root) / "pgc_v1.2/zscore_v1_2.csv")
trait_names = list(Z.index)

common_trait_names = sorted(
    trait_names,
    key=lambda trait: traits_meta[trait]['group']
)

S_51, G_51, R_51, R_p_51, S_se_51, G_se_51, R_se_51 = [
    df.loc[common_trait_names, common_trait_names]
    for df in (S, G, R, R_p, S_se, G_se, R_se)
]

make_heatmap_figure(S_51, G_51)
offdiag_check(S_51, G_51, R_51, R_p_51)

|Sampling Covariance| ∈ [0.00,0.05)
    n =  1076
    ρ = +0.134
    median|rg| = 0.198
    95th|rg| = 0.572
    frac_sig = 0.556
|Sampling Covariance| ∈ [0.05,0.10)
    n =    86
    ρ = +0.006
    median|rg| = 0.515
    95th|rg| = 0.854
    frac_sig = 0.977
|Sampling Covariance| ∈ [0.10,0.20)
    n =    70
    ρ = +0.088
    median|rg| = 0.538
    95th|rg| = 0.850
    frac_sig = 0.943
|Sampling Covariance| ∈ [0.20,0.40)
    n =    31
    ρ = +0.375
    median|rg| = 0.801
    95th|rg| = 1.202
    frac_sig = 1.000
|Sampling Covariance| ∈ [0.40,2.01)
    n =    12
    ρ = -0.378
    median|rg| = 0.902
    95th|rg| = 1.138
    frac_sig = 0.833
{'spearman': 0.30867082856852446,
 'pearson': 0.3899733385363103,
 'mantel_p': 9.999000099990002e-05,
 'x': array([0.001368  , 0.00216529, 0.0007015 , ..., 0.14691438, 0.14256507,
        0.00458009]),
 'y': array([-0.0037, -0.0076, -0.0311, ...,  0.0032,  0.014 ,  0.0025])}