def stratify_dfcol(df, colname, value):
#return pd_utils.select_dfrows(df, [f"$({colname}) == {value}"])
if value is None:
return df.loc[df[colname].isnull()]
else:
return df.loc[df[colname] == value]
def stratify_dfcols(df, condition_list):
for (colname, value) in condition_list:
df = stratify_dfcol(df, colname, value)
return df
def stratify_dfcols_in_list(df, colname, values):
return df.loc[df[colname].isin(values)]
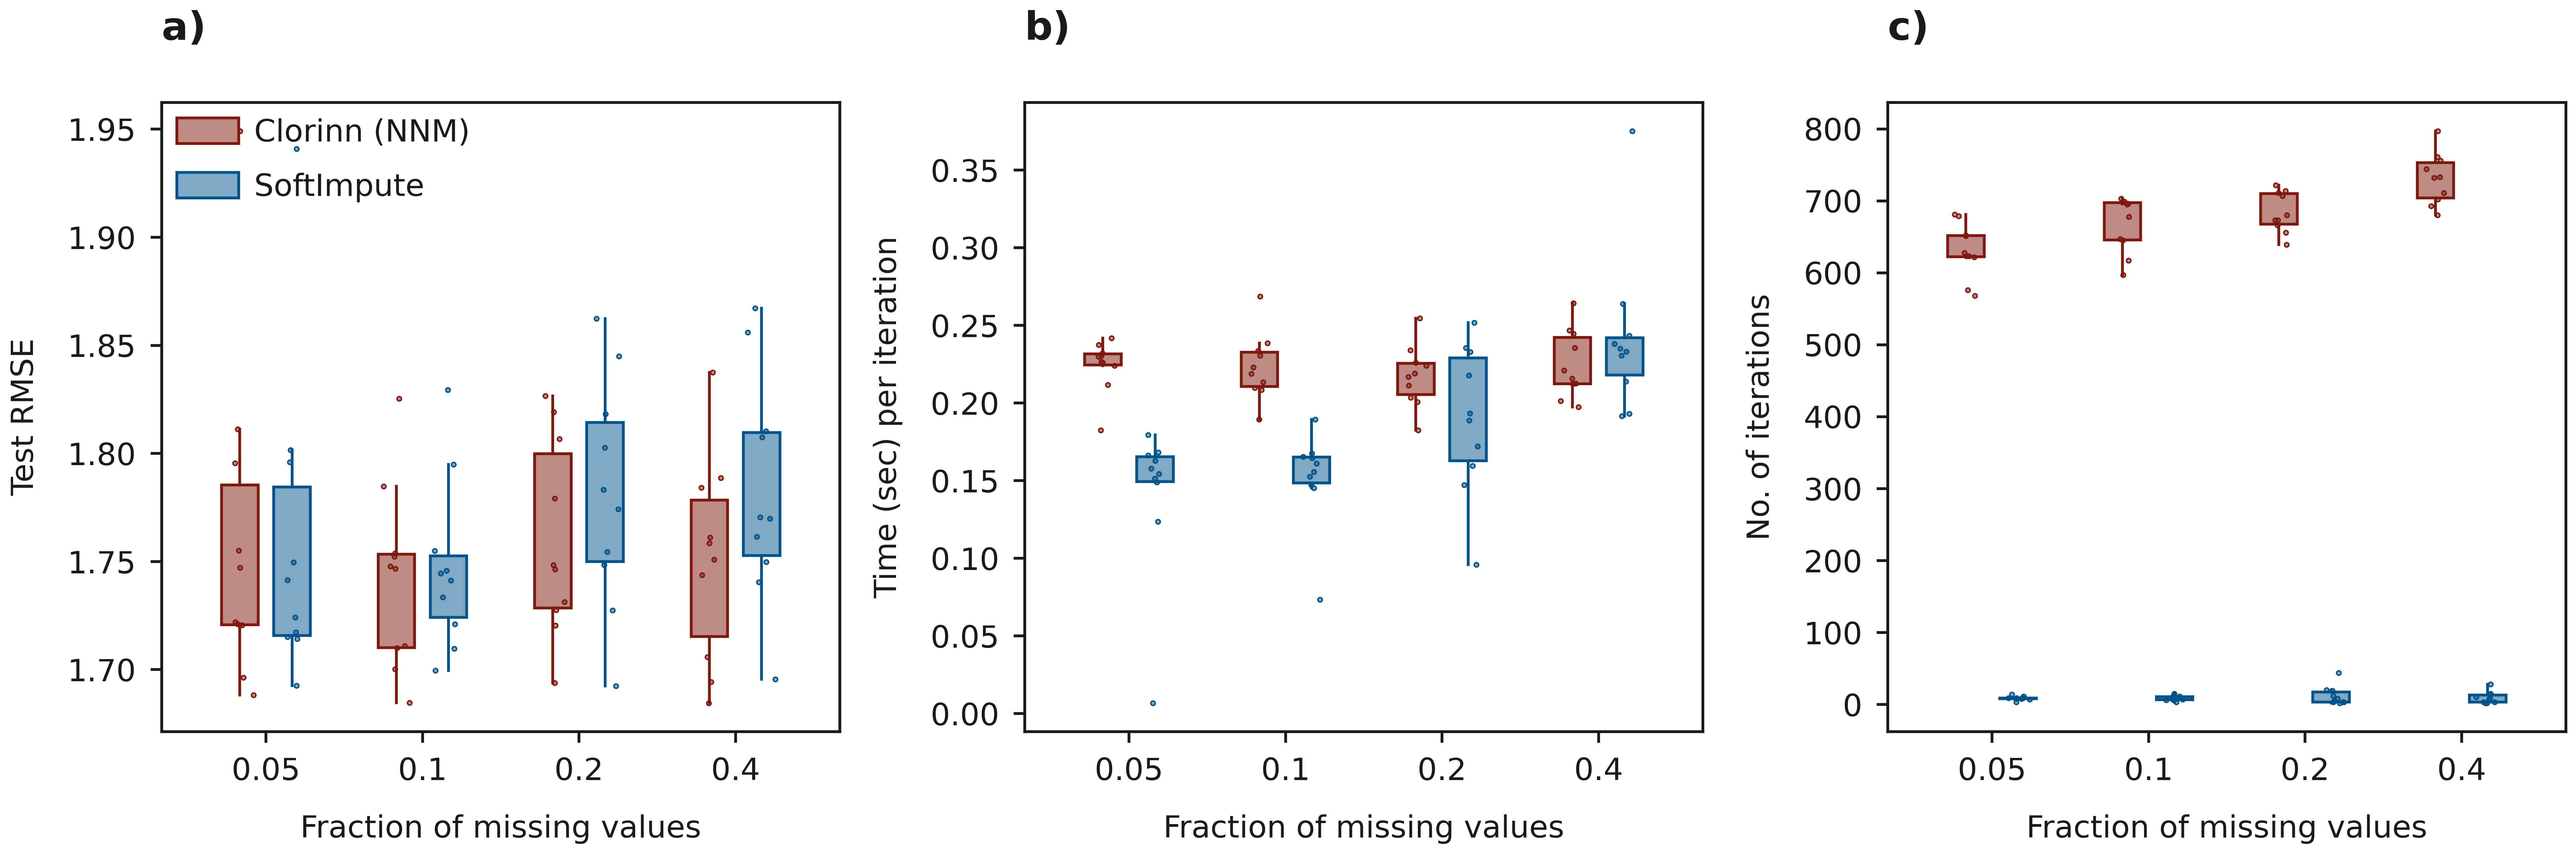
method_labels = {
"frankwolfe" : "Clorinn (NNM)",
"softimpute": "SoftImpute",
}
method_colors = {
"frankwolfe" : manuscript_colors['brown'],
"softimpute" : manuscript_colors['blue'],
}
# Base parameters
simparams = {'p': 2000, 'k': 10, 'h2': 0.2, 'h2_shared_frac': 0.4, 'aq': 0.6}
score_names = {
'test_rmse': "Test RMSE",
'time_per_iter': "Time (sec) per iteration",
'n_iter': "No. of iterations"
}
panel_labels = ["a)", "b)", "c)"]
def get_simulation_with_variable(df, var_name, var_values):
condition = [(f'input_with_nan.{k}', v) for k, v in simparams.items() if k != var_name]
df1 = stratify_dfcols(df, condition)
df2 = stratify_dfcols_in_list(df1, f'input_with_nan.{var_name}', var_values)
return df2
def get_scores_from_dataframe(df, score_name, variable_name, variable_values,
methods = method_labels.keys()):
simdf = get_simulation_with_variable(df, variable_name, variable_values)
scores = {key: list() for key in methods}
for method in methods:
mrows = stratify_dfcols(simdf, [('mcmethods', method)])
# mrows = stratify_dfcols(simdf, [('lowrankfit', mlist[0]), ('mfmethods', mlist[1])])
for value in variable_values:
vrows = stratify_dfcol(mrows, f'input_with_nan.{variable_name}', value)
scores[method].append(vrows[f'score.{score_name}'].to_numpy())
return scores
def random_jitter(xvals, yvals, d = 0.1):
xjitter = [x + np.random.randn(len(y)) * d for x, y in zip(xvals, yvals)]
return xjitter
def boxplot_scores(variable, variable_values,
methods = method_labels.keys(), score_names = score_names,
dscout = dscout, method_colors = method_colors,
panel_labels = None,
custom_font = 'Futura Std', xlabel = "Fraction of missing values"):
nmethods = len(methods)
nvariables = len(variable_values)
nscores = len(score_names)
figh = 8
figw = (nscores * figh) + (nscores - 1)
fig = plt.figure(figsize = (figw, figh + 1))
axs = [fig.add_subplot(1, nscores, x+1) for x in range(nscores)]
boxs = {x: None for x in methods}
for i, (score_name, score_label) in enumerate(score_names.items()):
scores = get_scores_from_dataframe(dscout, score_name, variable, variable_values)
for j, mkey in enumerate(methods):
boxcolor = method_colors[mkey]
boxface = f'#{boxcolor[1:]}80'
medianprops = dict(linewidth=0, color = boxcolor)
whiskerprops = dict(linewidth=2, color = boxcolor)
boxprops = dict(linewidth=2, color = boxcolor, facecolor = boxface)
flierprops = dict(marker='o', markerfacecolor=boxface, markersize=3, markeredgecolor = boxcolor)
xpos = [x * (nmethods + 1) + j for x in range(nvariables)]
boxs[mkey] = axs[i].boxplot(scores[mkey], positions = xpos,
showcaps = False, showfliers = False,
widths = 0.7, patch_artist = True, notch = False,
flierprops = flierprops, boxprops = boxprops,
medianprops = medianprops, whiskerprops = whiskerprops)
axs[i].scatter(random_jitter(xpos, scores[mkey]), scores[mkey],
edgecolor = boxcolor, facecolor = boxface, linewidths = 1,
s = 10)
xcenter = [x * (nmethods + 1) + (nmethods - 1) / 2 for x in range(nvariables)]
axs[i].set_xticks(xcenter)
axs[i].set_xticklabels(variable_values)
axs[i].set_xlabel(xlabel)
axs[i].set_ylabel(score_label)
xlim_low = 0 - (nvariables - 1) / 2
#xlim_high = (nvariables - 1) * (nmethods + 1) + (nmethods - 1) + (nvariables - 1) / 2
xlim_high = (nmethods + 1.5) * nvariables - 2.5
axs[i].set_xlim( xlim_low, xlim_high )
if panel_labels is not None:
axs[i].text(0, 1.1, panel_labels[i], transform=axs[i].transAxes,
fontweight='bold', fontsize = 28)
plt.tight_layout()
return axs, boxs
variable = 'missing_ratio'
variable_values = [0.05, 0.1, 0.2, 0.4]
axs, boxs = boxplot_scores(variable, variable_values, panel_labels = panel_labels)
handles = [boxs[mkey]["boxes"][0] for mkey in method_labels.keys()]
labels = [method_labels[mkey] for mkey in method_labels.keys()]
axs[0].legend(handles = handles, labels = labels,
loc = 'upper left', frameon = False, handlelength = 2, ncol = 1)
# plt.tight_layout()
# plt.savefig('../plots/softimpute_benchmark_results.png', bbox_inches='tight')
plt.savefig('../plots/softimpute_benchmark_results.pdf', bbox_inches='tight')
plt.show()