fig = plt.figure(figsize = (12, 14))
ax1 = fig.add_subplot(111)
# ax1.set_aspect('equal')
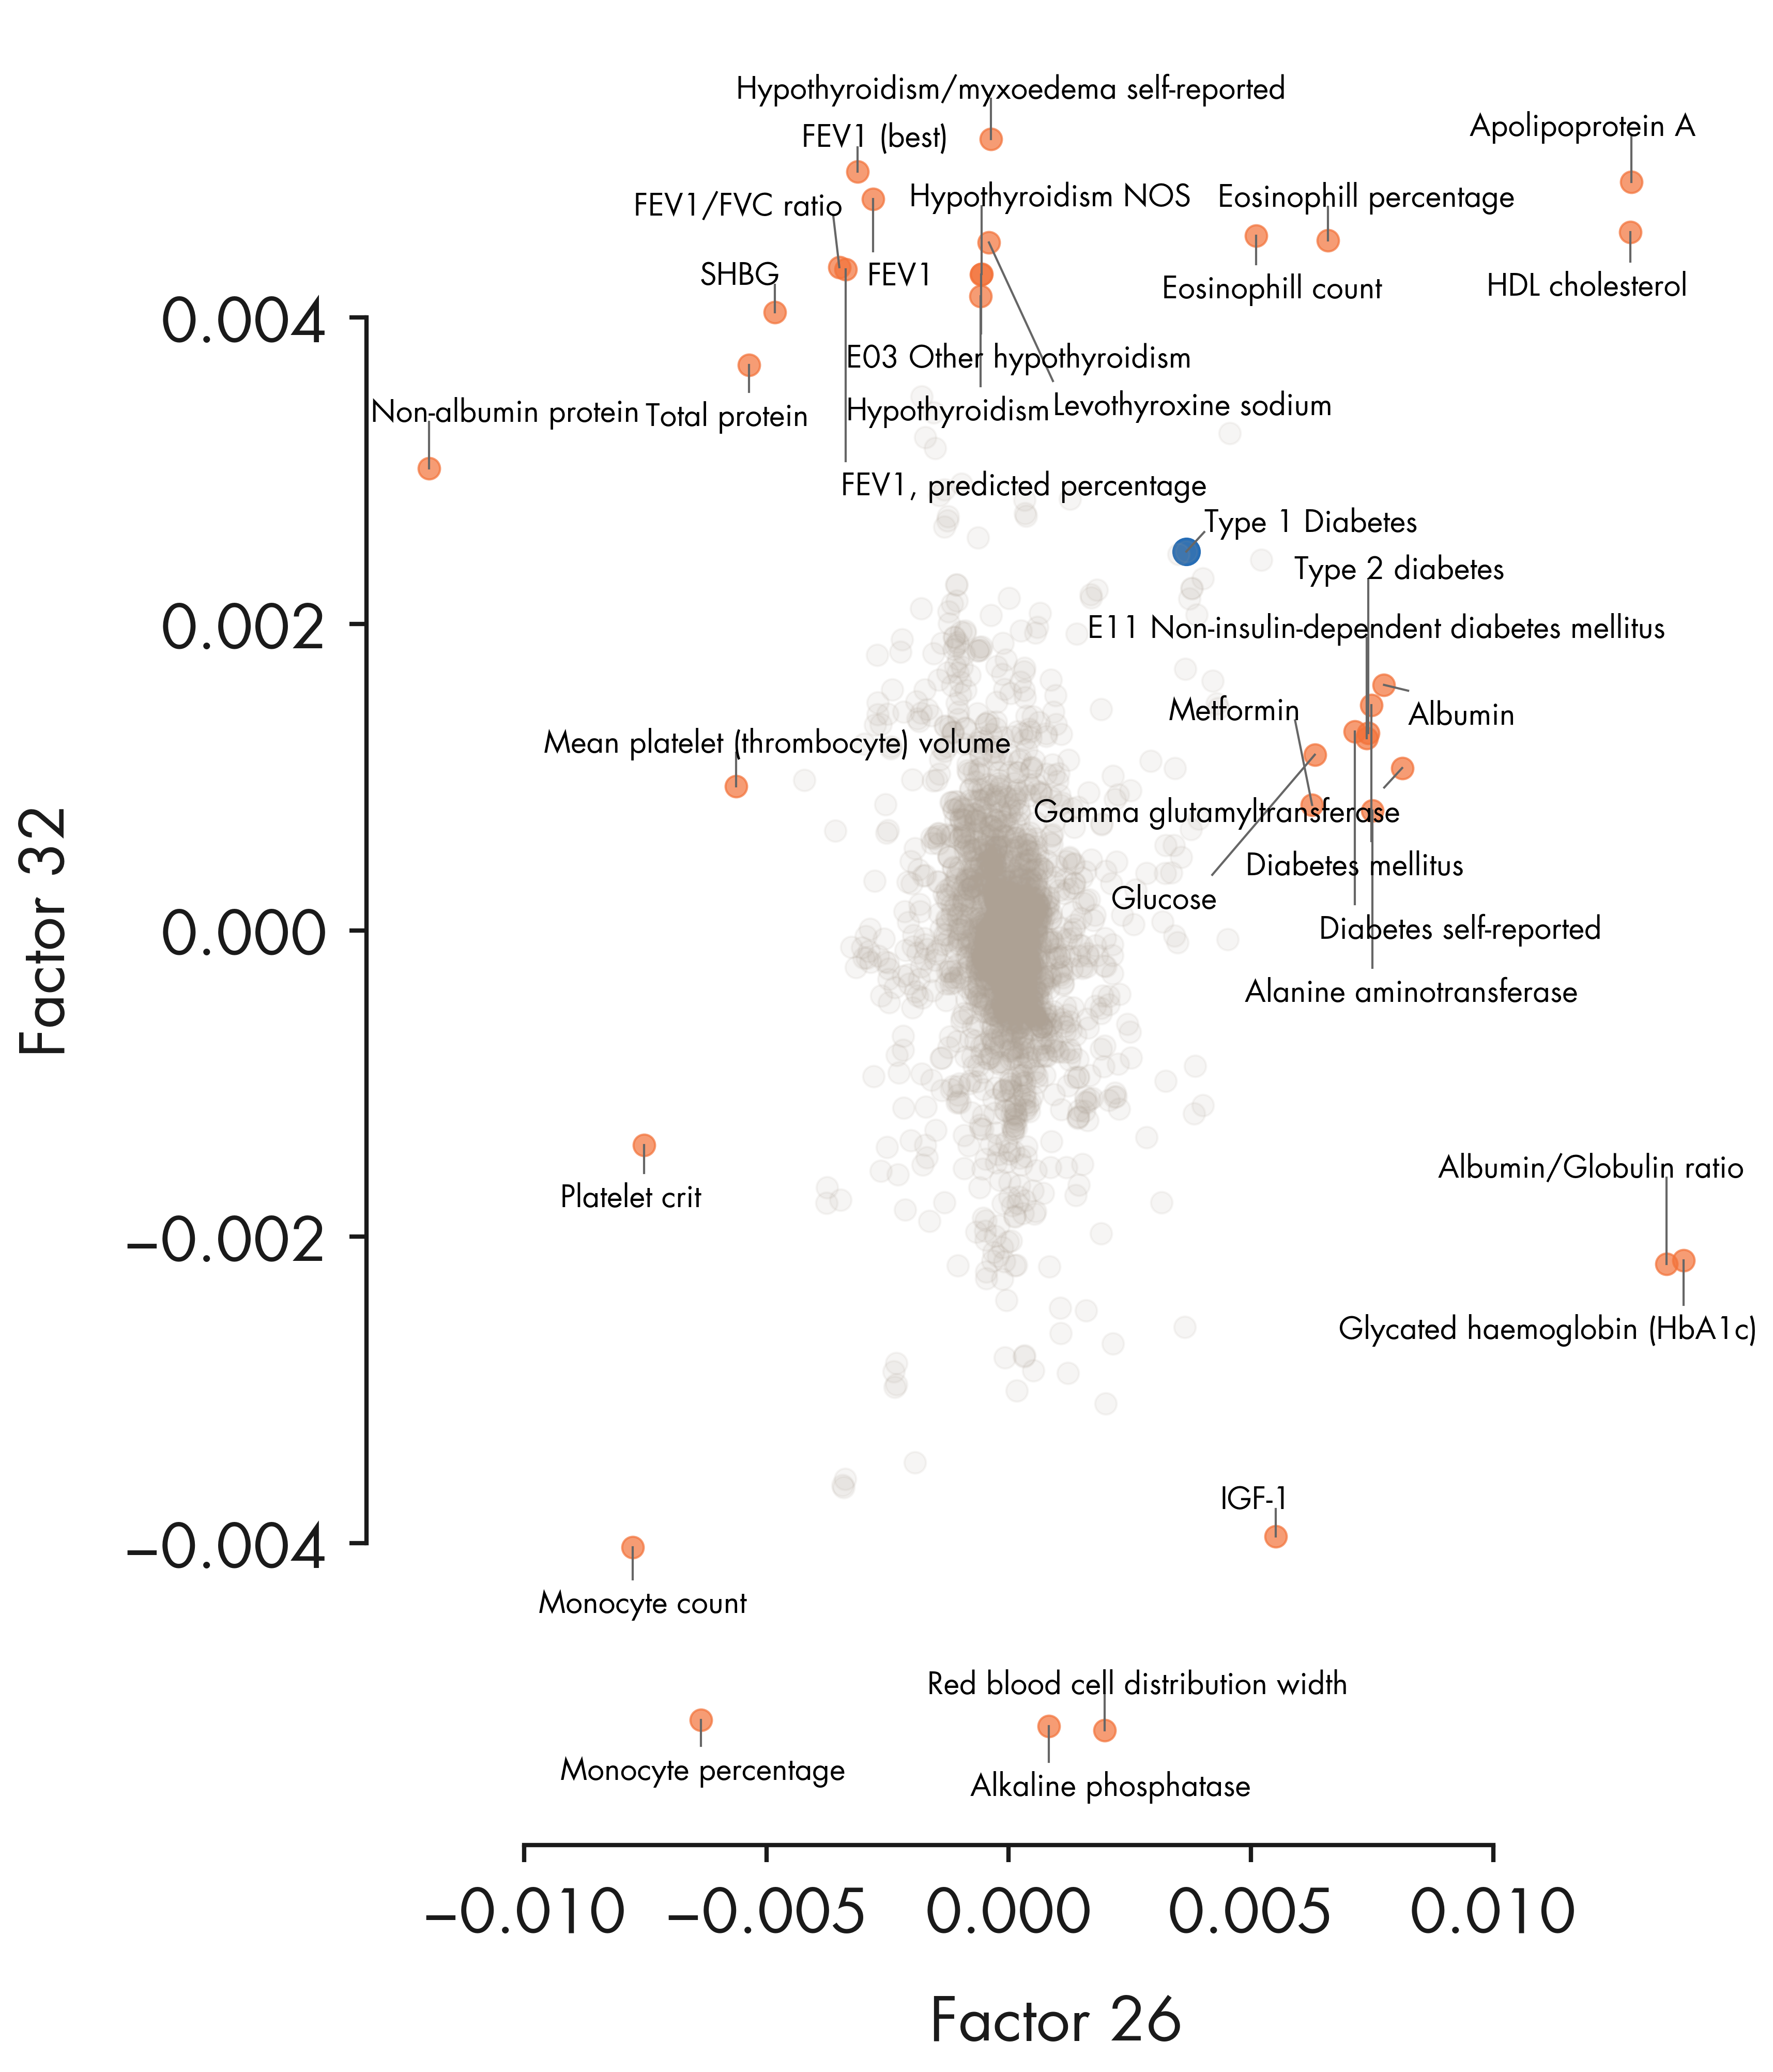
xvals = loadings[:, top_factor1]
yvals = - loadings[:, top_factor2]
# Combine outliers in x-axis and y-axis
# outlier_idx_x = np.where(iqr_outlier(xvals, axis = 0, bar = 5.0))[0]
# outlier_idx_y = np.where(iqr_outlier(yvals, axis = 0, bar = 5.0))[0]
outlier_idx_x = np.argsort(contribution_pheno[:, top_factor1])[::-1][:20]
outlier_idx_y = np.argsort(contribution_pheno[:, top_factor2])[::-1][:20]
outlier_idx = np.union1d(outlier_idx_x, outlier_idx_y)
x_center = np.mean(ax1.get_xlim())
common_idx = np.setdiff1d(np.arange(xvals.shape[0]), outlier_idx)
scatter_plot = ax1.scatter(xvals[outlier_idx], yvals[outlier_idx], alpha = 0.7, s = 100, color = nygc_colors['orange'])
ax1.scatter(xvals[tidx], yvals[tidx], s = 150, color = nygc_colors['blue'])
ax1.scatter(xvals[common_idx], yvals[common_idx], alpha = 0.1, s = 100, color = nygc_colors['khaki'])
# # Mark using adjustText package
# # https://github.com/Phlya/adjustText
# annots = []
# for i in outlier_idx:
# txt = trait_df.loc[trait_indices[i]]['description'].strip()
# if 'intima-medial thickness' in txt:
# continue
# if xvals[i] > x_center:
# annots += [ax1.annotate(txt, (xvals[i], yvals[i]), fontsize = 6, ha = 'right')]
# else:
# annots += [ax1.annotate(txt, (xvals[i], yvals[i]), fontsize = 6)]
# # Adjust the annotations iteratively
# adjust_text(annots, arrowprops=dict(arrowstyle='-', color = 'grey'))
# Mark using textalloc package
txt_list = []
text_idx_list = []
for i in outlier_idx:
txt = trait_df_noRx.loc[trait_indices[i]]['short_description'].strip()
txt_list.append(txt)
text_idx_list.append(i)
# Mark Type 1 diabetes
txt_list.append("Type 1 Diabetes")
text_idx_list.append(tidx)
if len(text_idx_list) > 0:
txt_idx = np.array(text_idx_list)
textalloc.allocate_text(fig, ax1, xvals[txt_idx], yvals[txt_idx], txt_list,
# x_scatter = xvals, y_scatter = yvals,
scatter_plot = scatter_plot,
textsize = 14, textcolor = 'black', linecolor = nygc_colors['gray'])
ax1.set_xticks([-0.010, -0.005, 0.0, 0.005, 0.010])
for side, border in ax1.spines.items():
if side == 'left':
border.set_bounds(-0.004, 0.004)
elif side == 'bottom':
border.set_bounds(-0.01, 0.01)
else:
border.set_visible(False)
ax1.set_xlabel(f"Factor {top_factor1 + 1}")
ax1.set_ylabel(f"Factor {top_factor2 + 1}")
plt.tight_layout()
# plt.savefig('../plots/ashg24/phenotype_contributions_top2factors_t1d.png', bbox_inches='tight')
plt.show()